Analyzing data with Discover
To explore and visualize your data in OpenSearch, you can use the Discover application in OpenSearch Dashboards. The following image shows the Discover application.
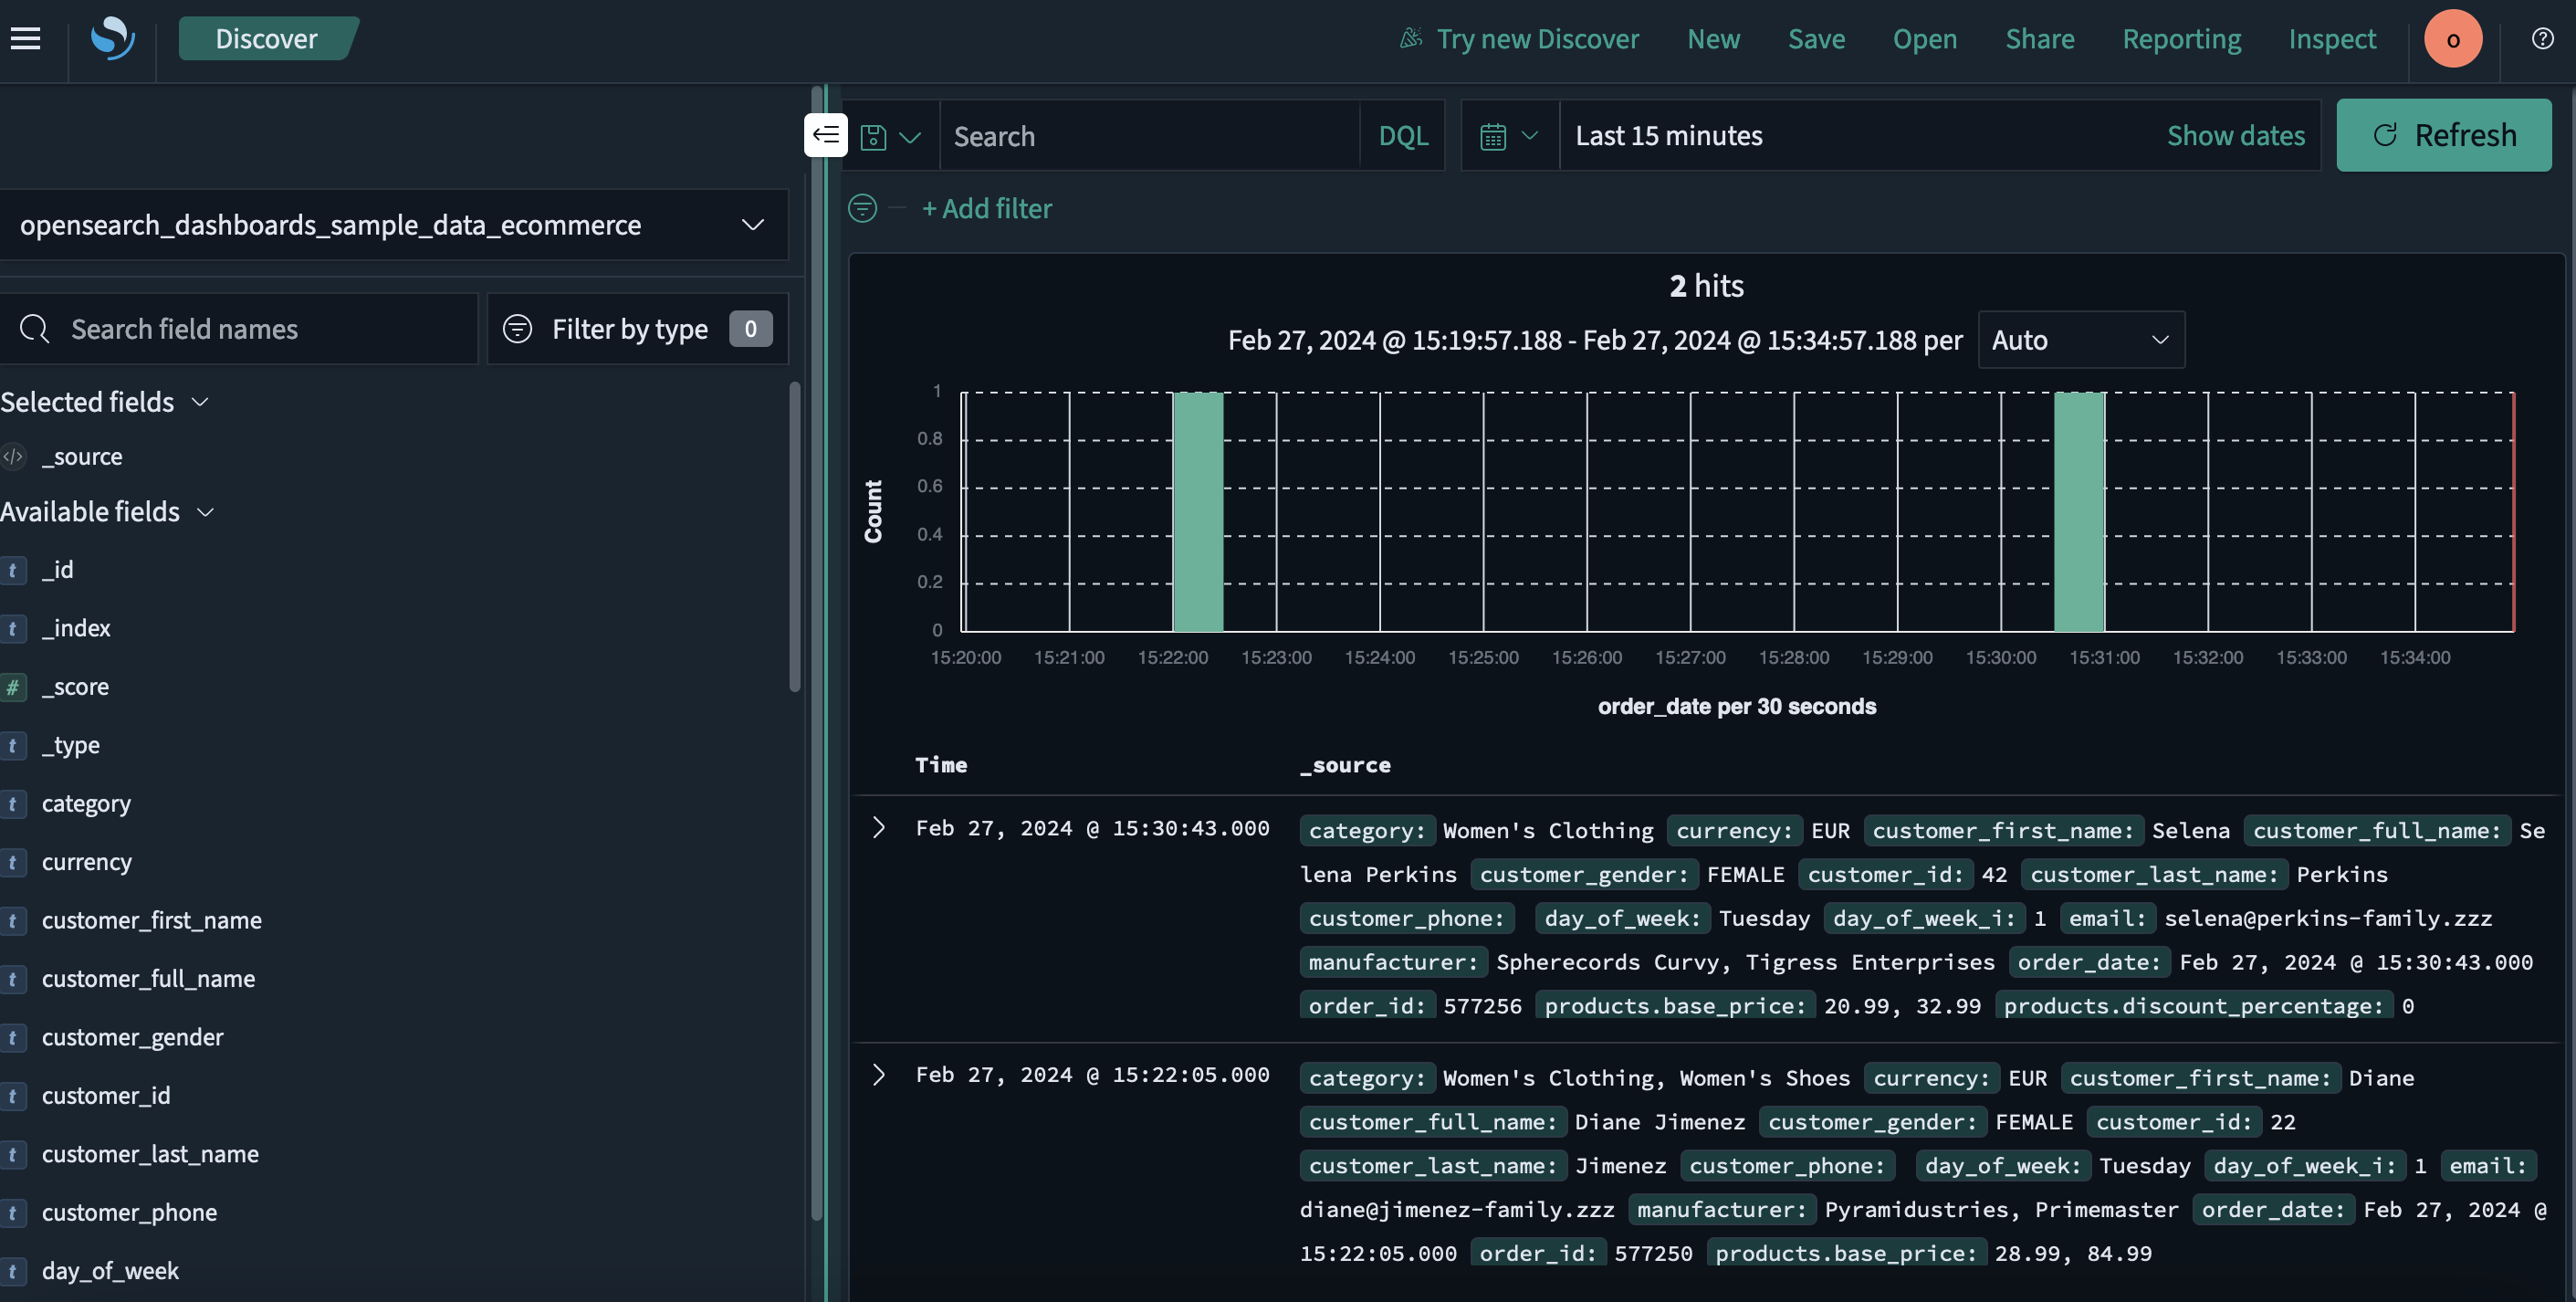
This page describes how to use Discover to:
- Add data.
- Interpret and visualize data.
- Share data findings.
- Set alerts.
Prerequisites
Before using the Discover tool, ensure that you:
-
Add sample data or import your own data into OpenSearch. To learn about adding sample datasets, see Adding sample data. To learn about importing your own data, see Managing indexes.
-
Know how to use the search bar and the time filter.
Defining a search
To define a search, follow these steps:
-
In the left navigation, select OpenSearch Dashboards > Discover.
-
Choose the data you want to work with from the upper-left dropdown menu. For the examples used in this guide, choose
opensearch_dashboards_sample_data_flights. -
Select the
 (calendar) icon to filter the time range of your search.
 -
Change the time filter from Last 15 minutes to Last 1 month.
-
Select Refresh.
The resulting view is shown in the following image.
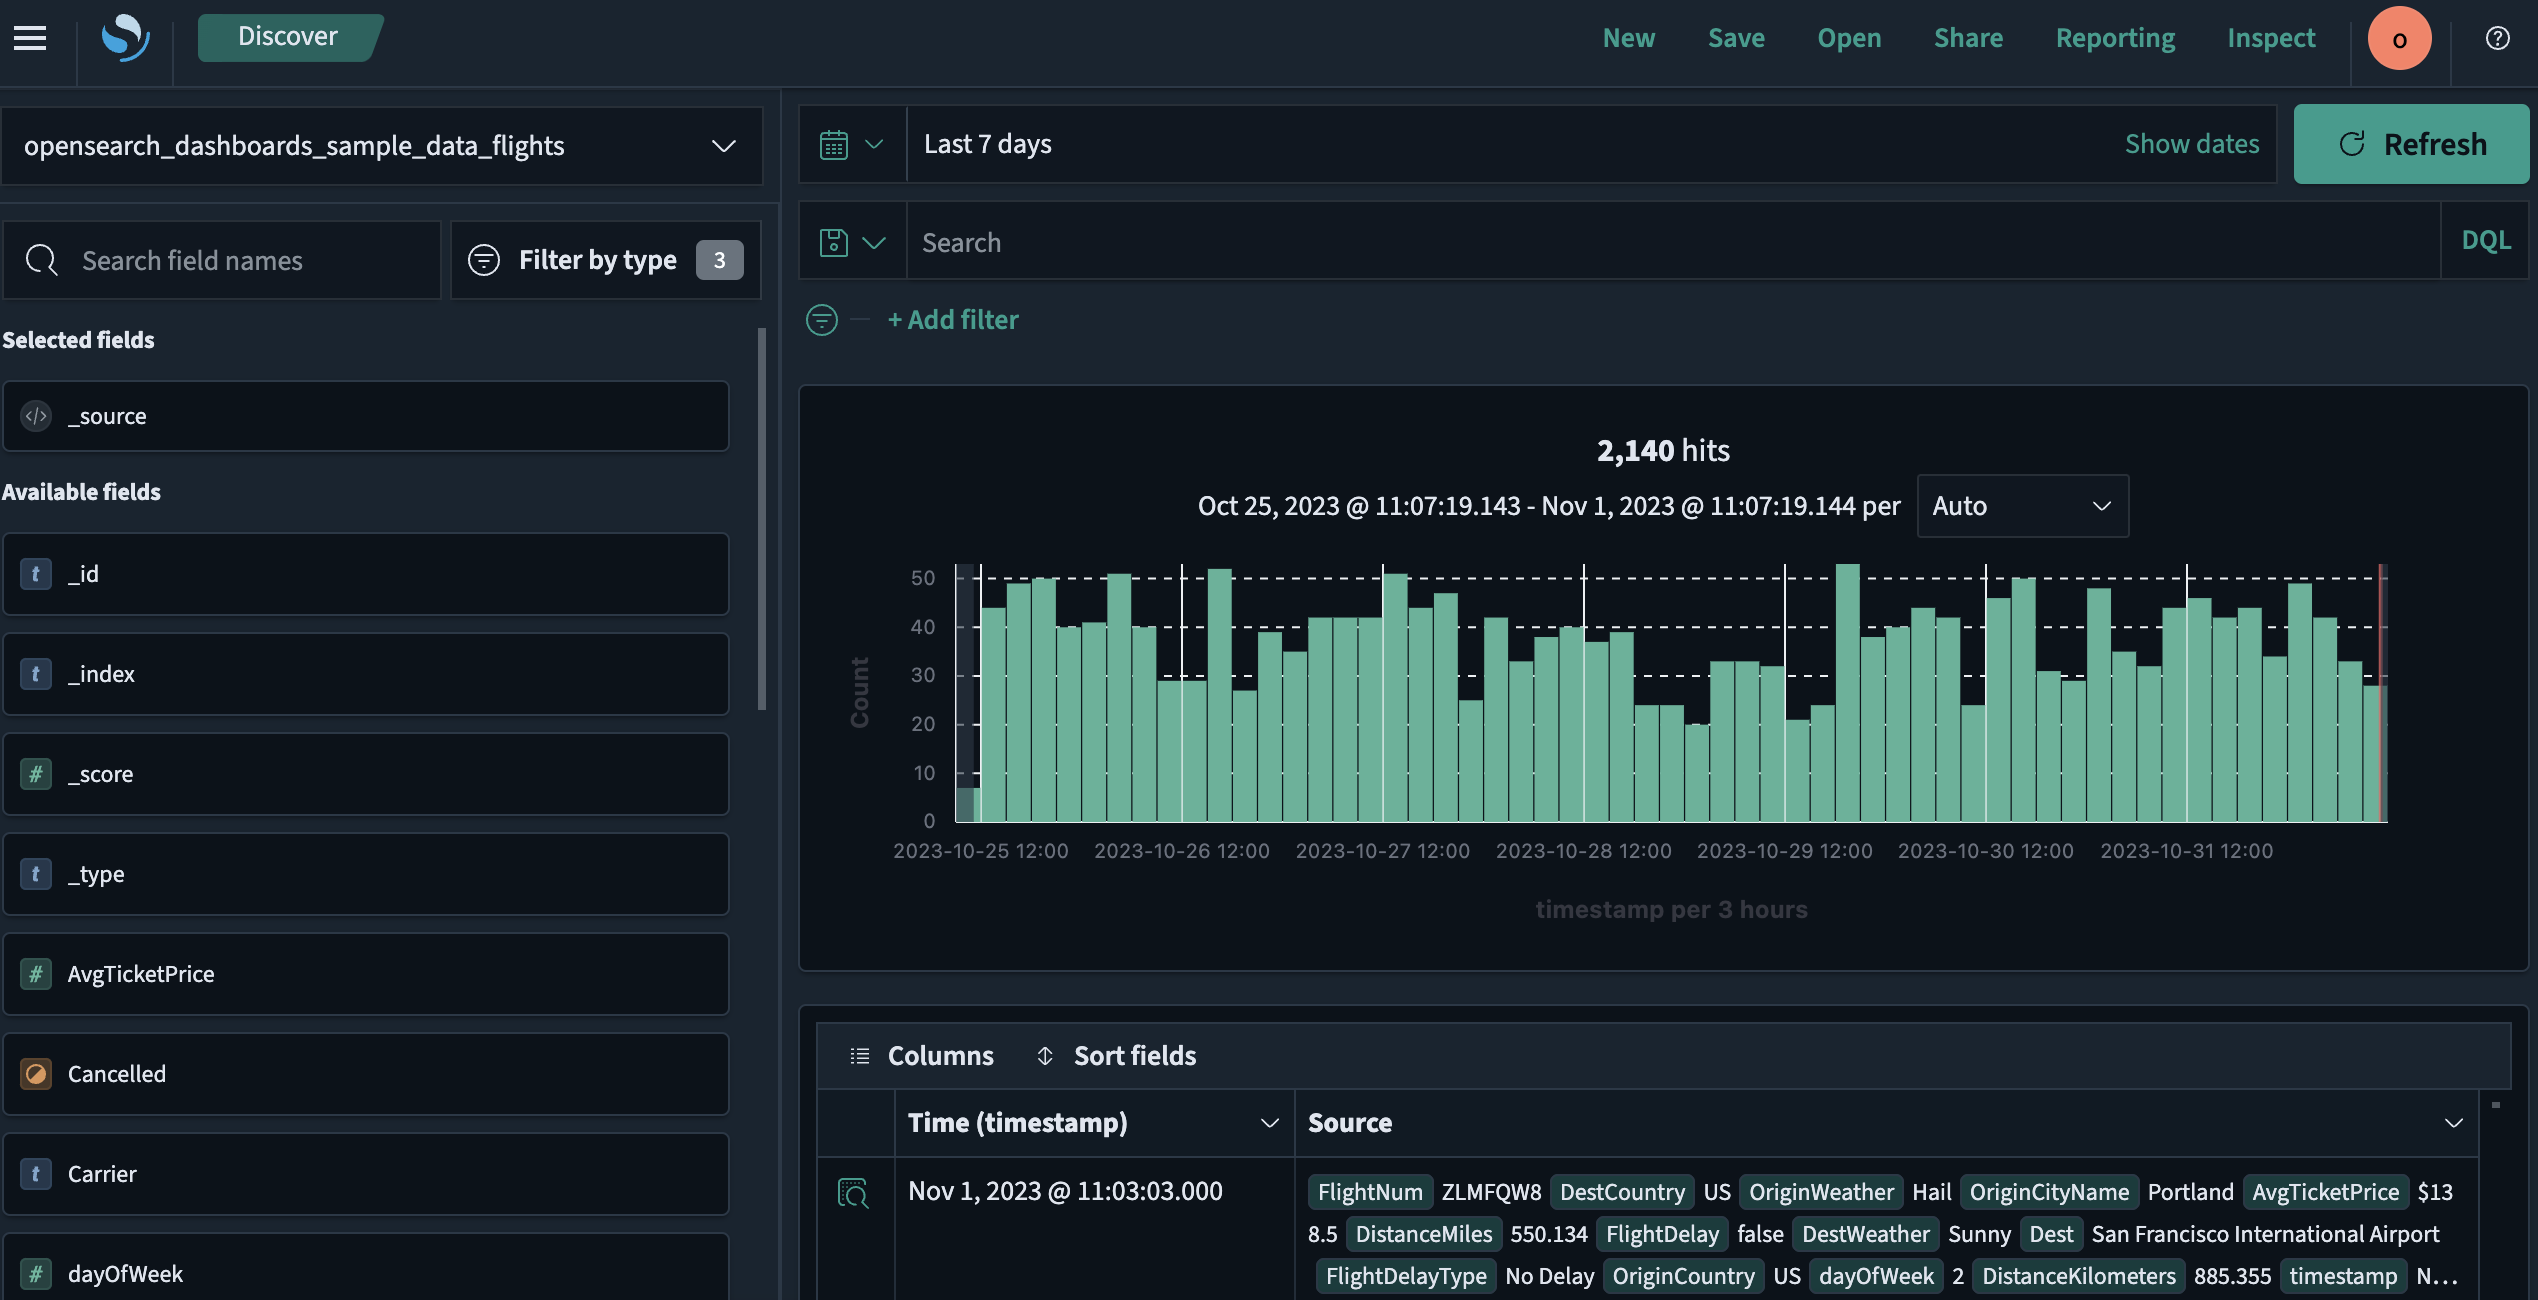
Viewing document tables
A document table displays unstructured data. Each row represents a single document, and each column contains document attributes.
To examine a document in the document table, follow these steps:
-
From a row in the data table’s left column, select the
 (expand) icon to open the Document Details window.
 -
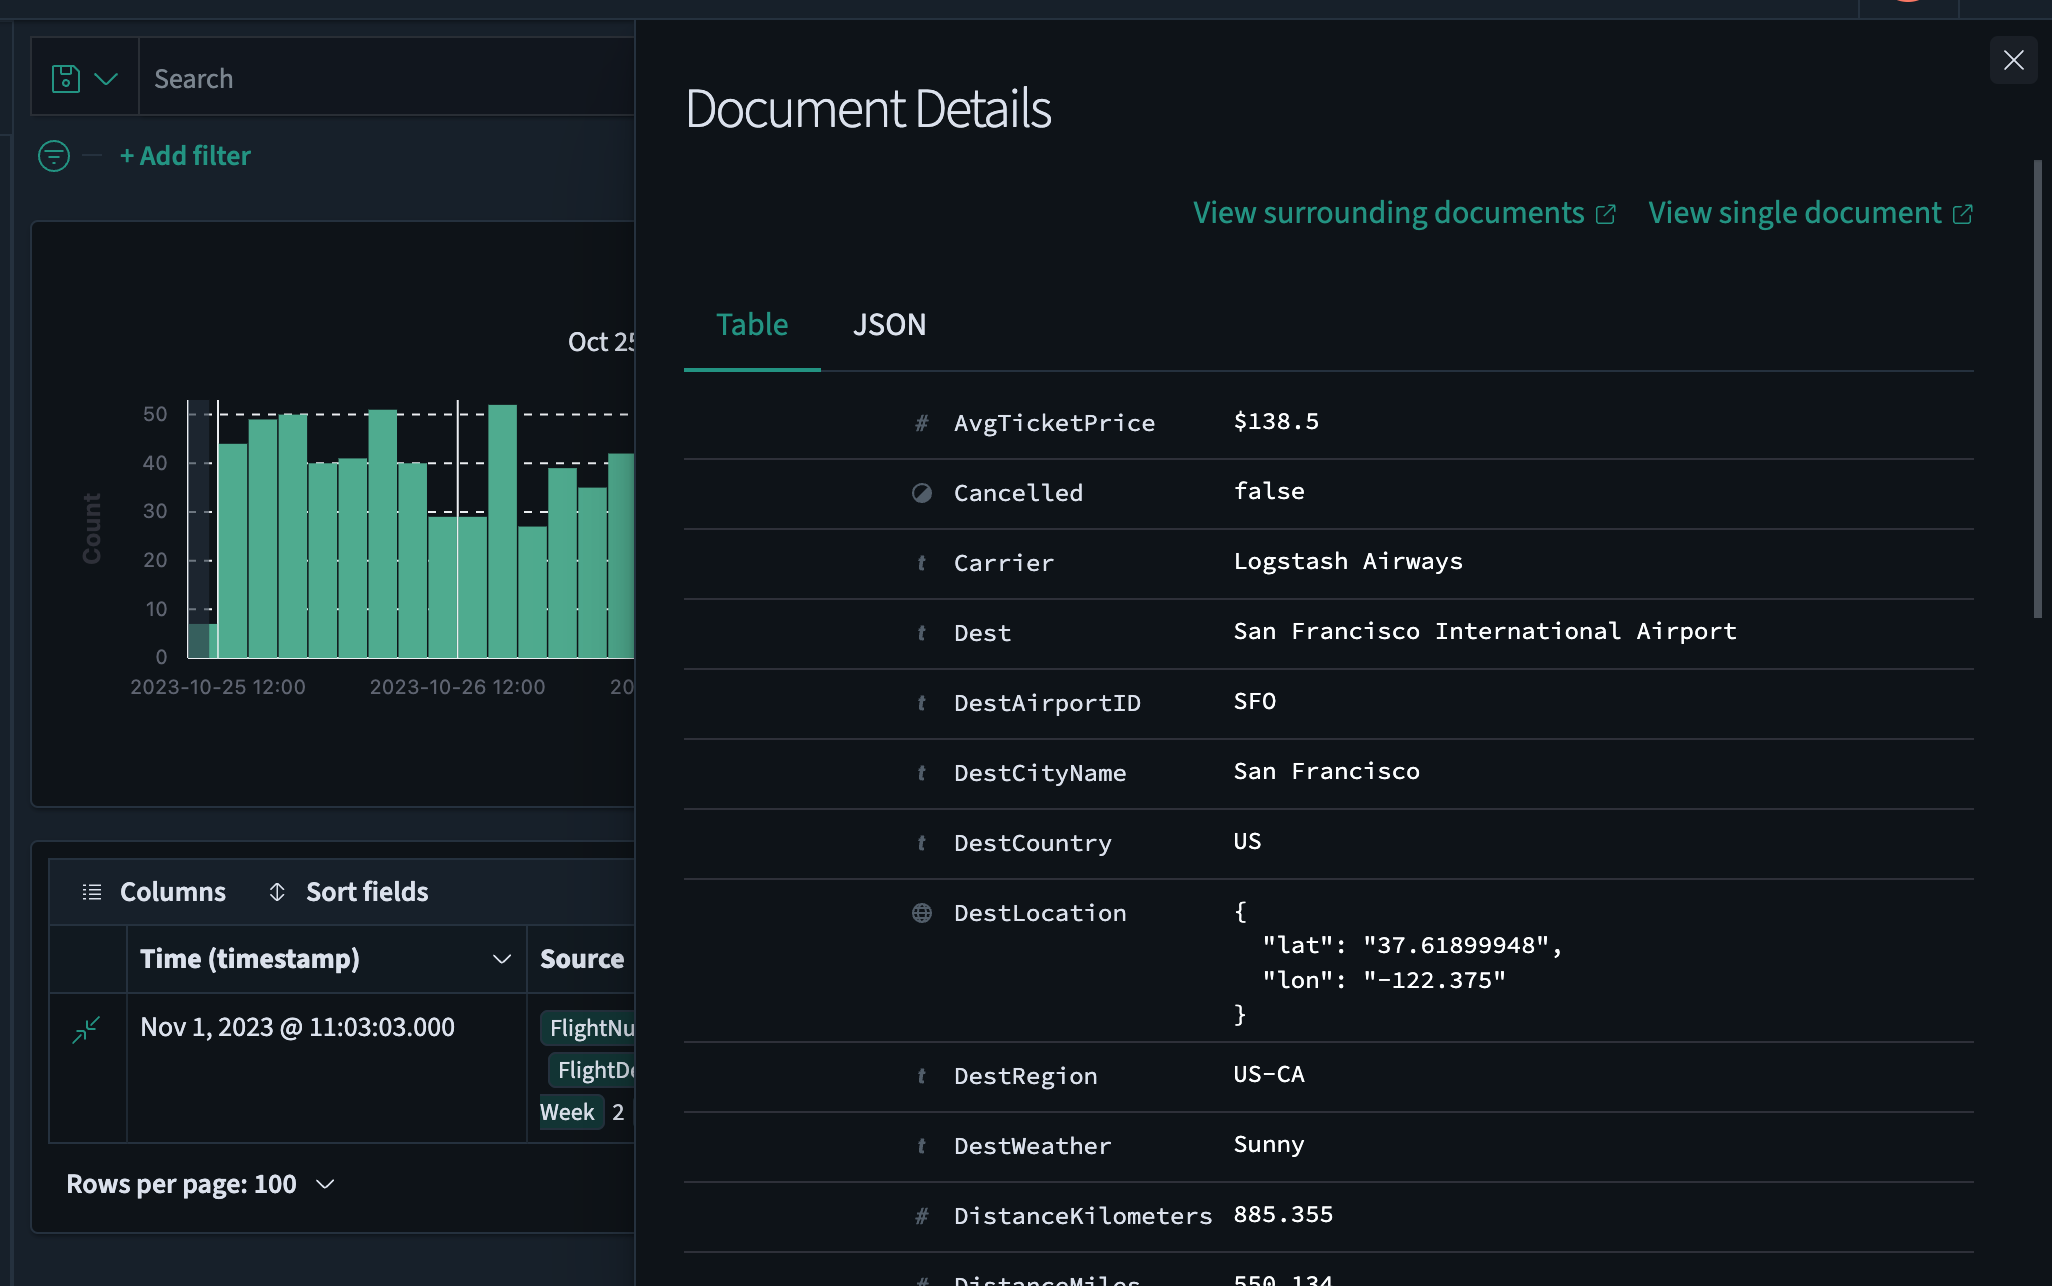
Choose between data formats by selecting the Table or JSON tab.
-
Select View surrounding documents to view data for other log entries either preceding or following your current document or select View single document to view a particular log entry.
The resulting view is shown in the following image.
-
Select the
 (down arrow) icon to close the Document Details window.
Adding and deleting fields in a document table
To add and delete fields in a document table, follow these steps:
-
View the data fields listed under Available fields and select the
 (plus) icon to add the desired fields to the document table. The fields are automatically added to both Selected fields and the document table. For this example, choose the fields
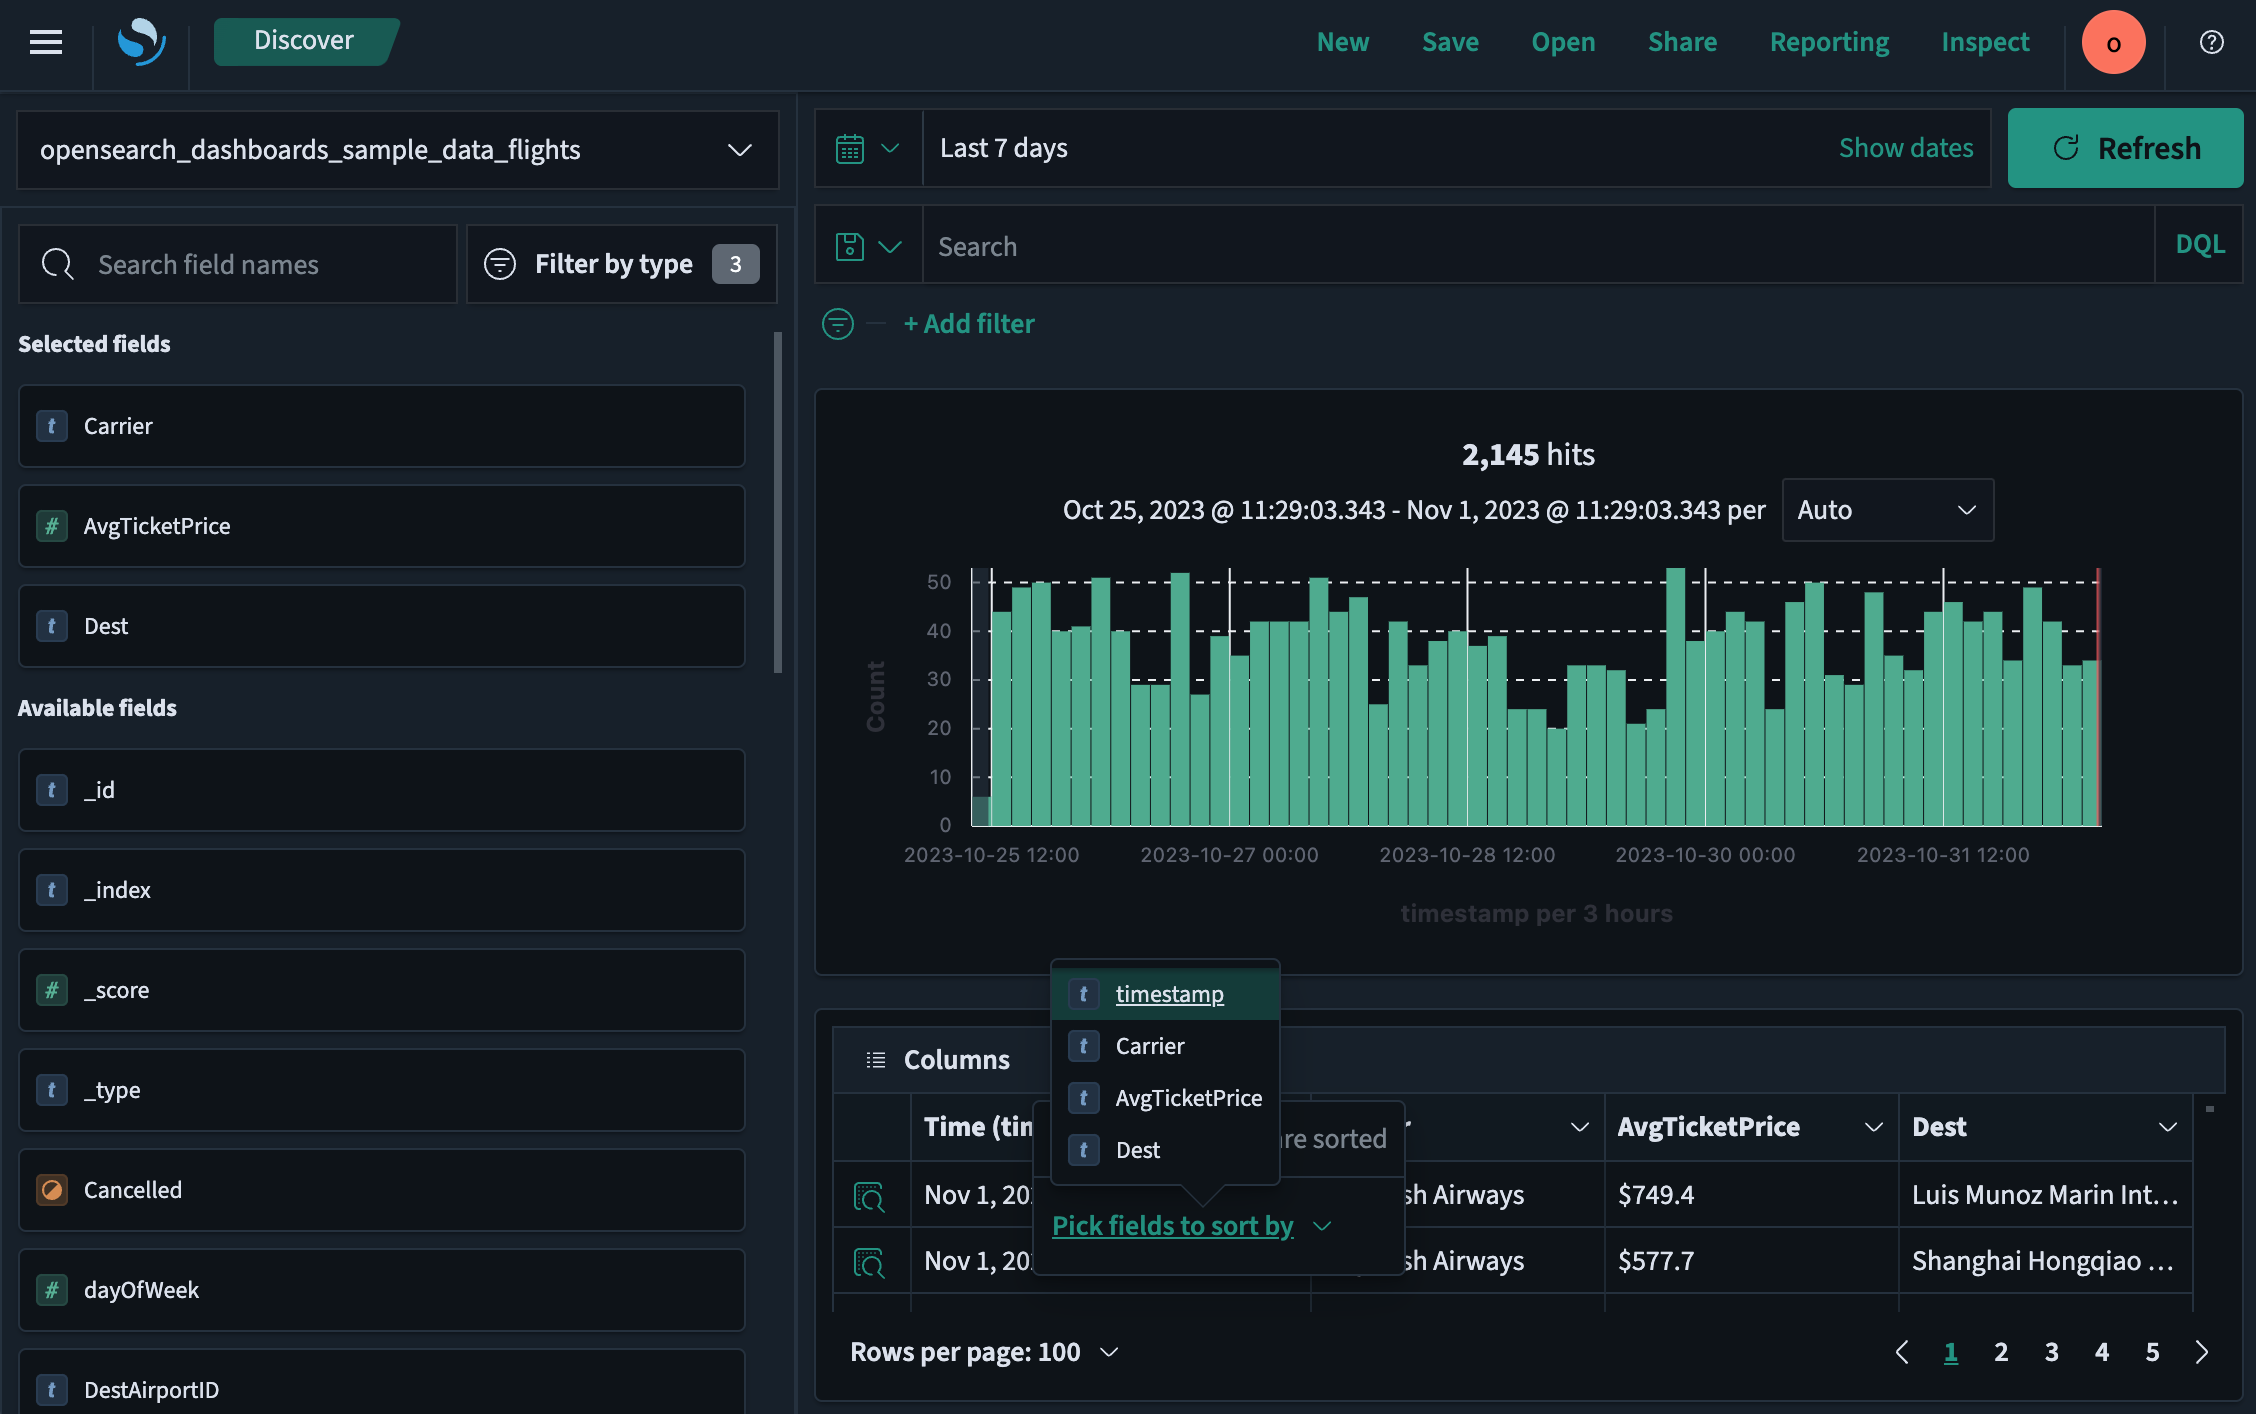
 Carrier,AvgTicketPrice, andDest. -
Select Sort fields > Pick fields to sort by. Drag and drop the chosen fields in the desired sort order.
The resulting view is shown in the following image.
Searching data
You can use the search toolbar to enter a DQL or query string query.
Use the search toolbar for basic queries. For full query and filter capability, use query domain-specific language (DSL) in the Dev Tools console.
For more information, see Search bar.
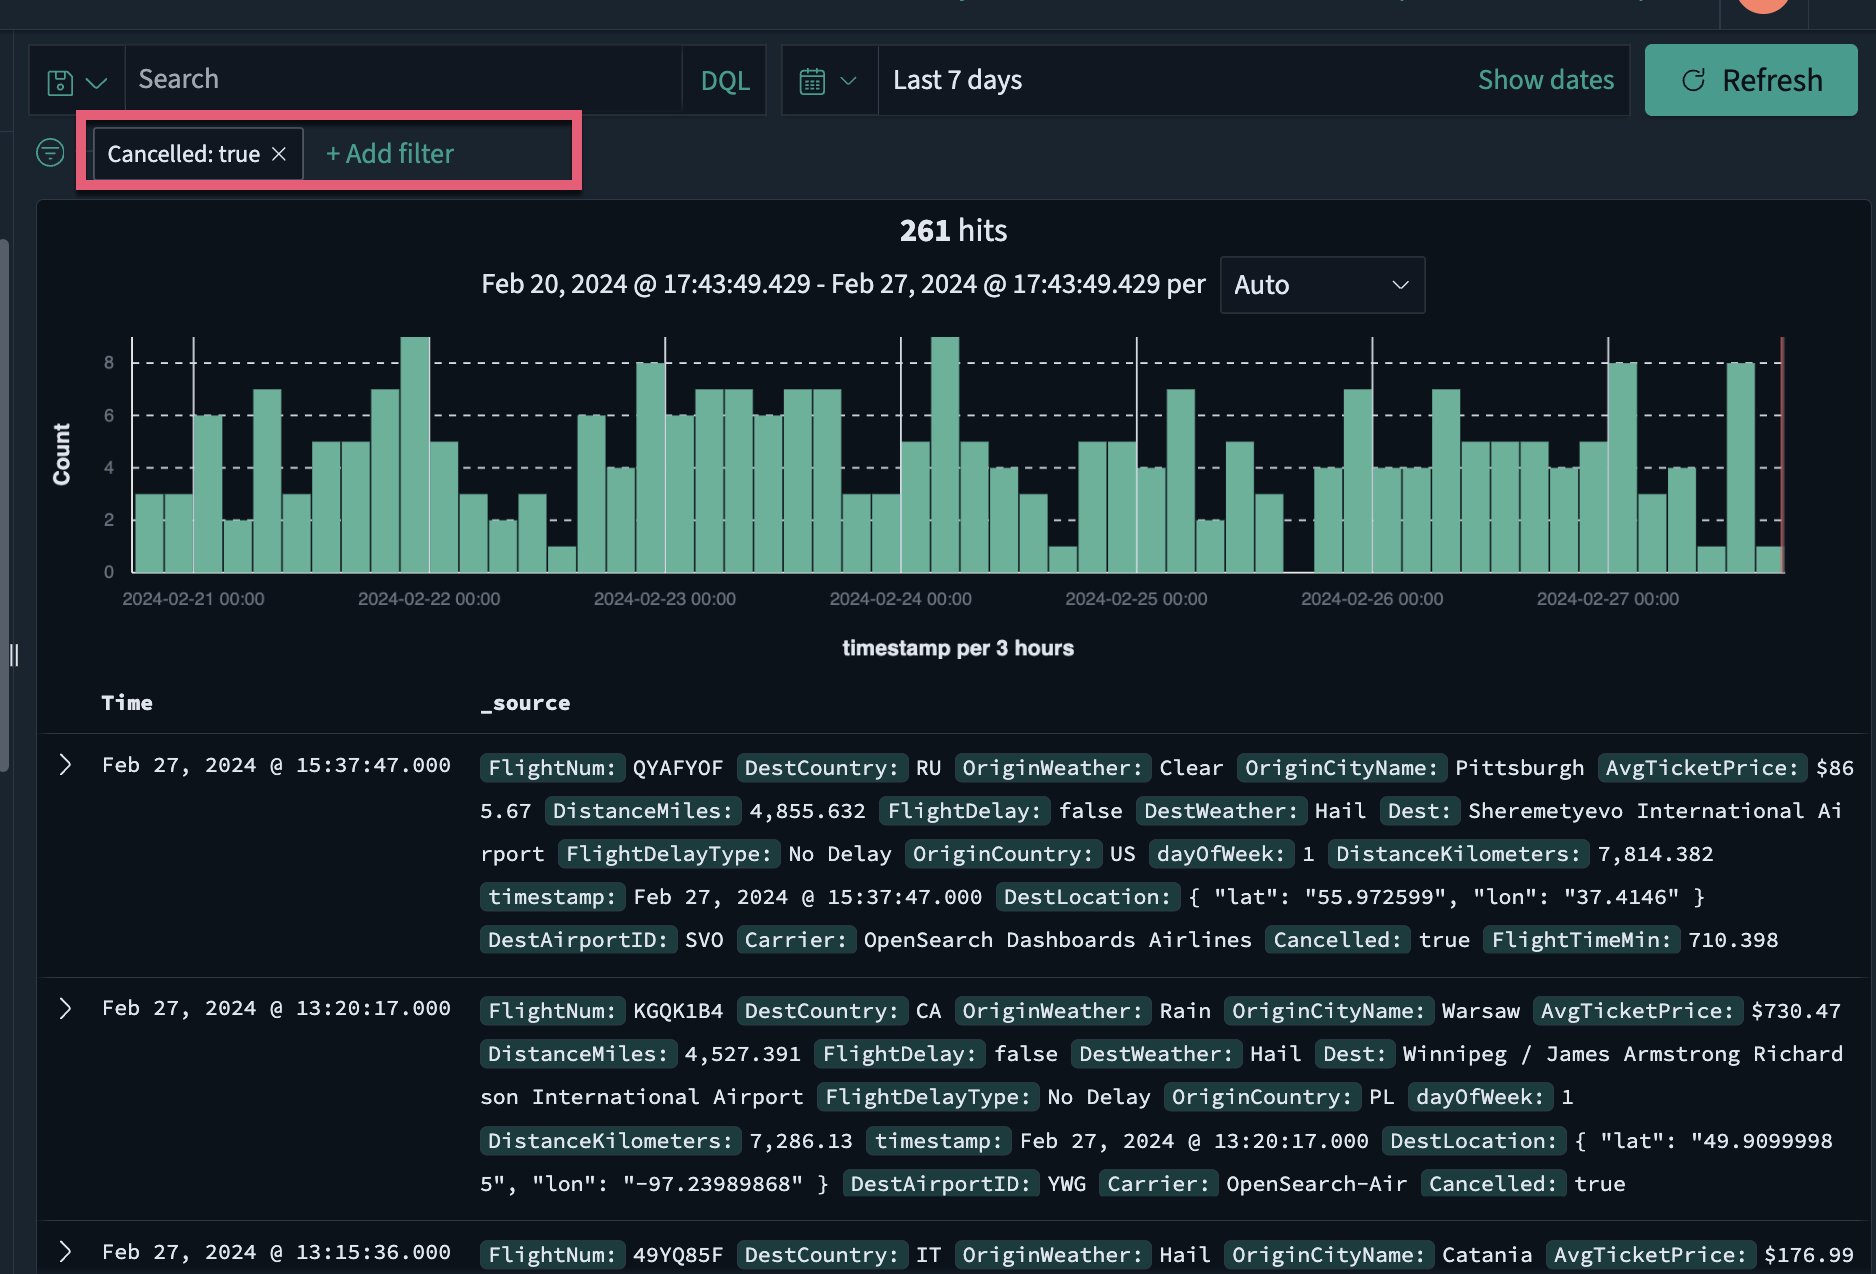
Filtering data
Filters allow you to narrow the results of a query by specifying a field, value, or range. The Add filter dialog lists the available fields and operators.
To filter your data, follow these steps:
-
Under the DQL search bar, choose Add filter.
-
Select the desired options from the Field, Operator, and Value dropdown lists. For example, select
Cancelled,is, andtrue. -
(Optional) Choose Create custom label? to assign a name to the search.
-
Choose Save.
The resulting view is shown in the following image.
To remove a filter, choose the ![]() (cross) icon to the right of the filter name.
(cross) icon to the right of the filter name.
Saving a search
To save your search, including the query text, filters, and current data view, follow these steps:
-
Select Save on the upper-right toolbar.
-
To save the search as a new search, choose Save as new search. Otherwise Save overwrites the current saved search.
-
To change the name of the current search or to add a new search, enter a new Title.
-
Choose Save.
Selecting a search
To select a saved search, follow these steps:
-
Select Open on the upper-right toolbar.
-
(Optional) Enter a search term to narrow the list.
-
Select a search from the list.
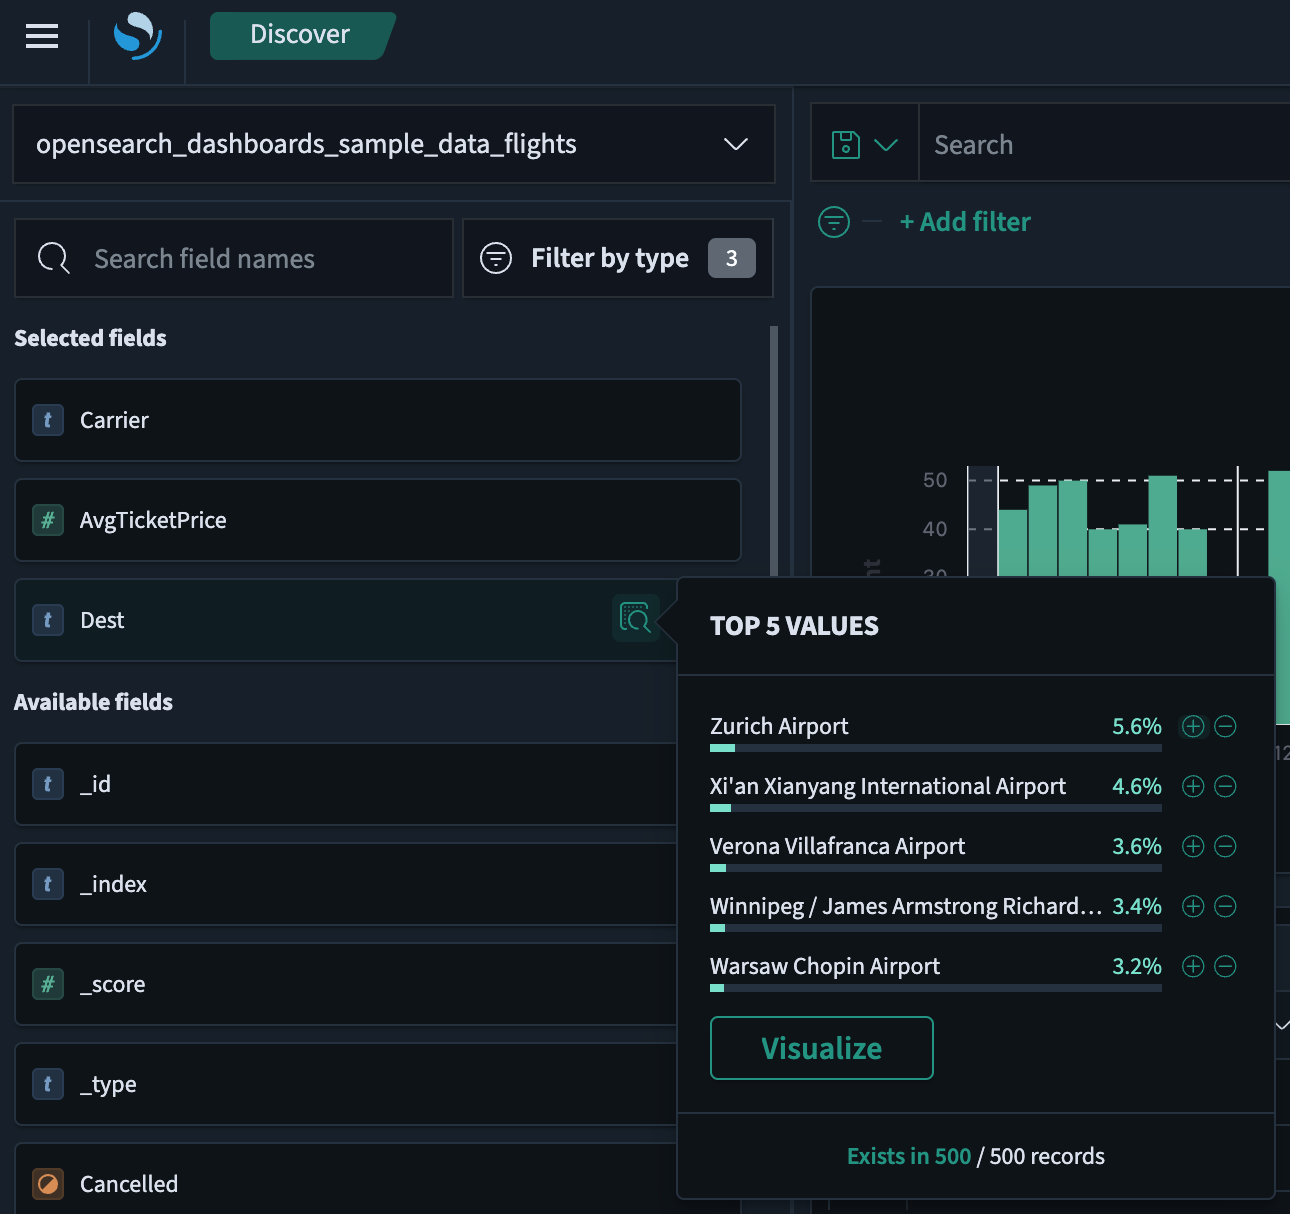
Visualizing data findings
To visualize your data findings, follow these steps:
-
In the field list, select the
 (inspect) icon to the right of the field you want to visualize.
The resulting view is shown in the following image.
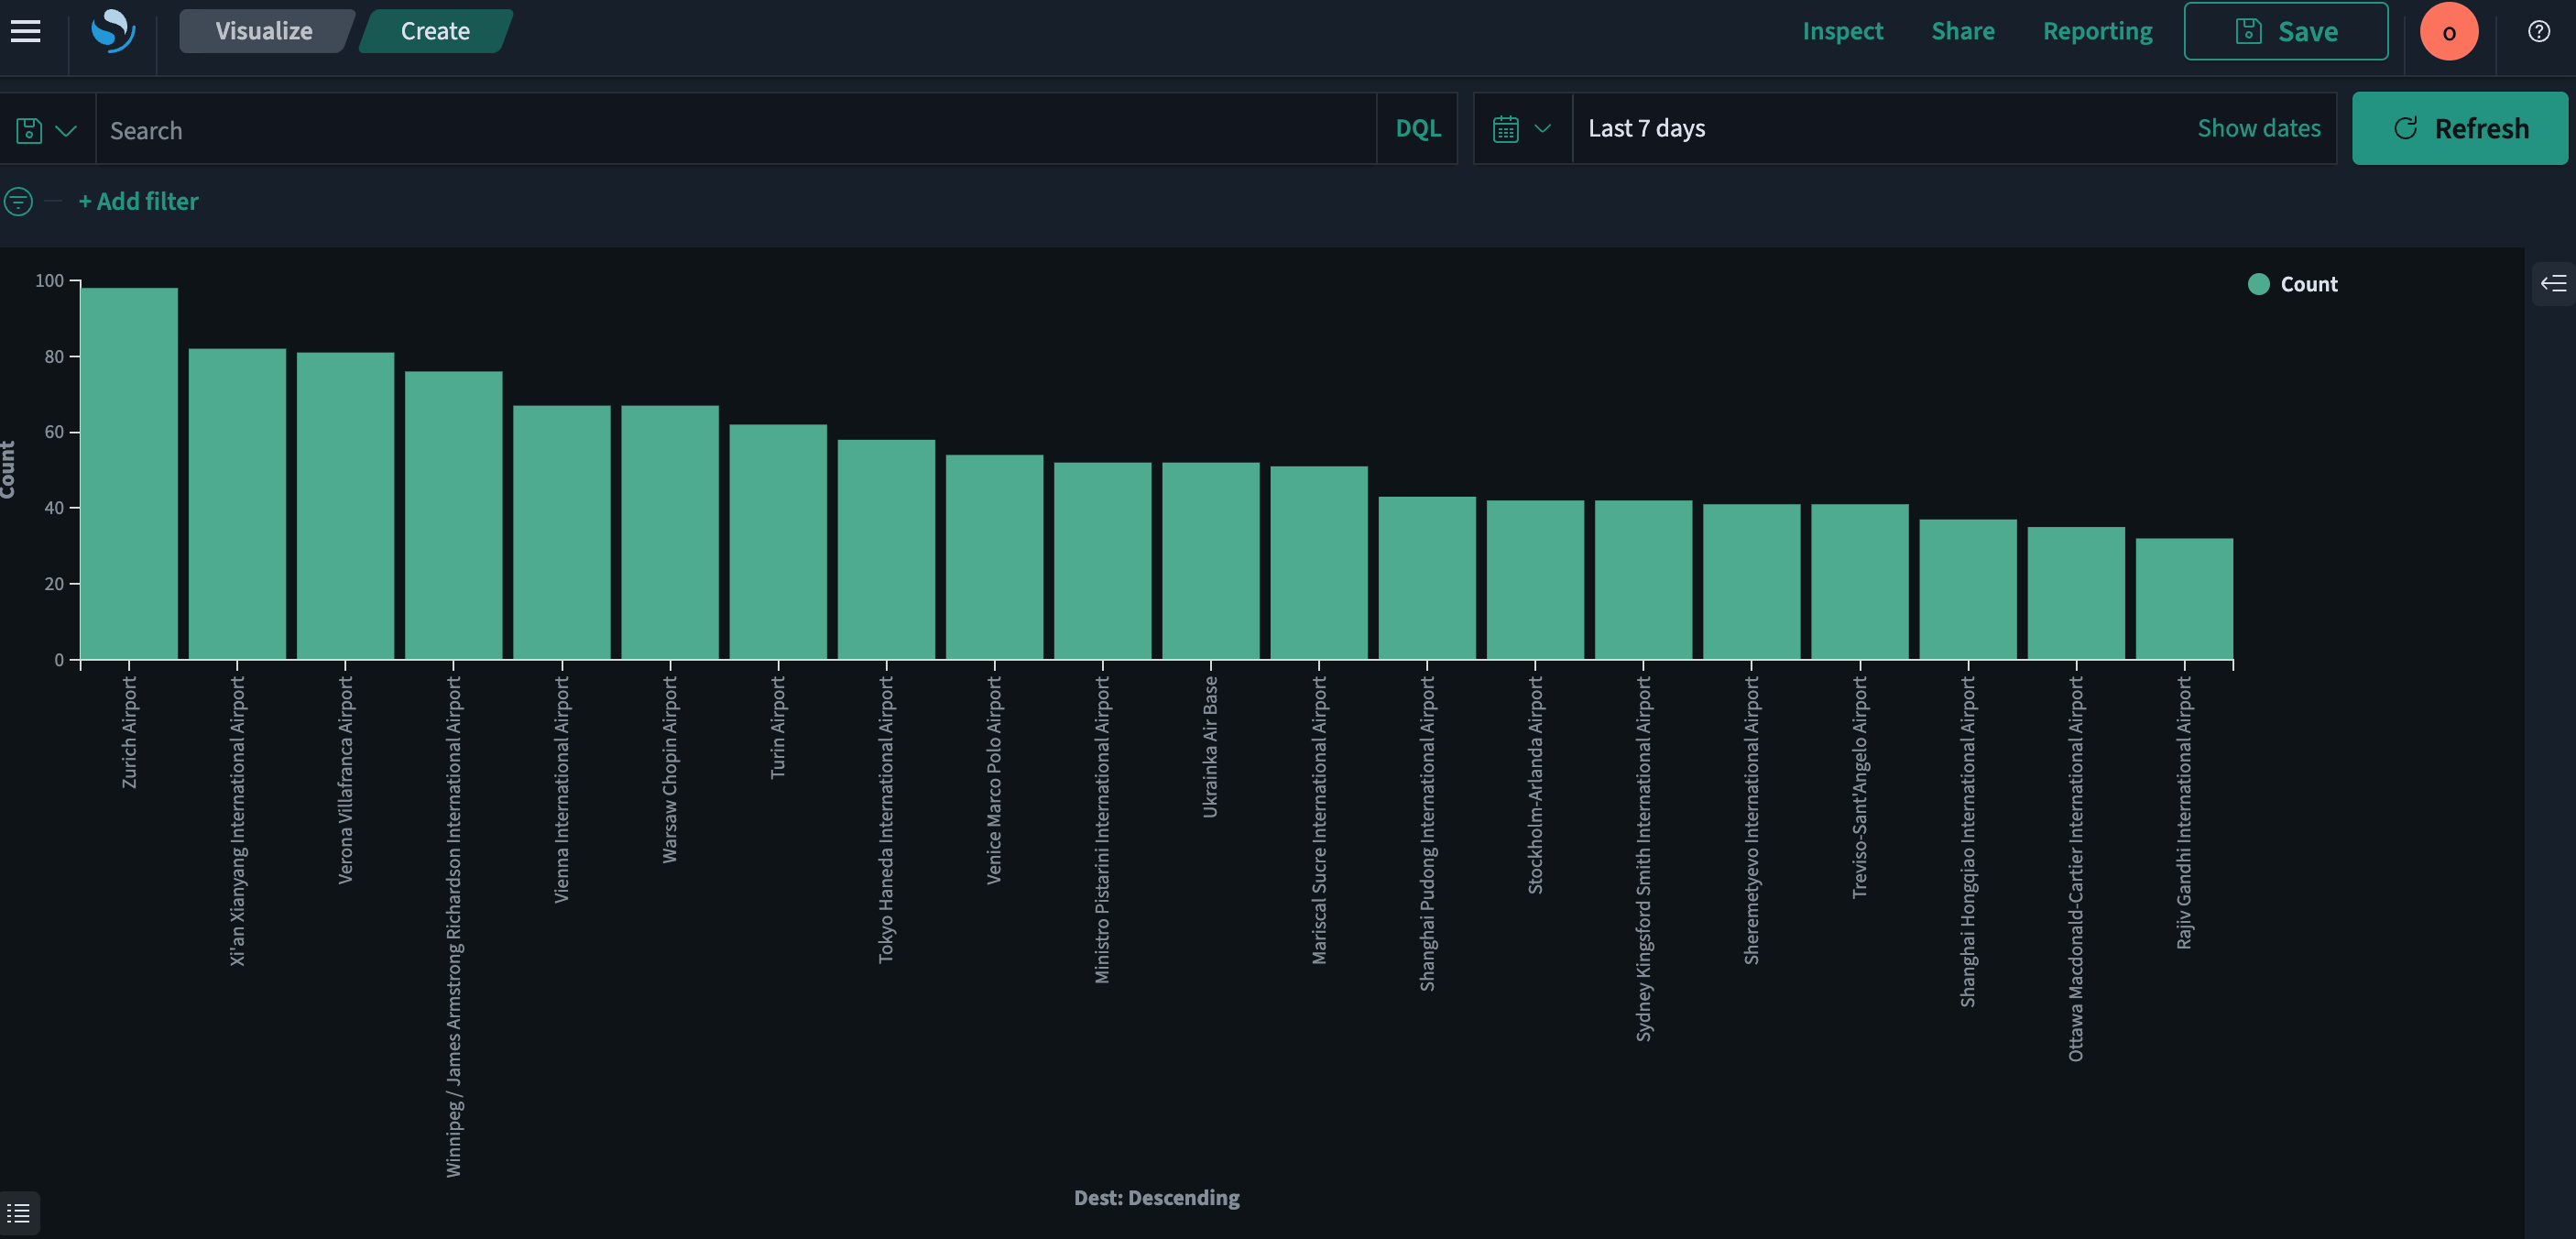
-
From the Top 5 values dialog, select the Visualize button. The display changes to the Visualize application, showing the selected visualization.
The resulting view is shown in the following image.
Setting alerts
You can set alerts to notify you when your data exceeds your specified thresholds.
To learn about creating and managing alerts, see Alerting dashboards and visualizations.