You're viewing version 3.6 of the OpenSearch documentation. This version is no longer maintained. For the latest version, see the current documentation. For information about OpenSearch version maintenance, see Release Schedule and Maintenance Policy.
Aggregations
OpenSearch is for more than search. Aggregations let you tap into OpenSearch’s powerful analytics engine to analyze your data and extract statistics from it.
The use cases of aggregations vary from analyzing data in real time to take some action to using OpenSearch Dashboards to create a visualization dashboard.
OpenSearch can perform aggregations on massive datasets in milliseconds. Compared to queries, aggregations consume more CPU cycles and memory.
General aggregation structure
The structure of an aggregation query is as follows:
GET _search
{
  "size": 0,
  "aggs": {
    "<aggregation_name>": {
      "<aggregation_type>": {}
    }
  }
}
If you’re only interested in the aggregation result and not in the results of the query, set size to 0.
In the aggs property (you can use aggregations if you want), you can define any number of aggregations. Each aggregation is defined by its name and one of the types of aggregations that OpenSearch supports.
The name of the aggregation helps you to distinguish between different aggregations in the response. The <aggregation_type> placeholder specifies the aggregation type, such as sum or min.
Example aggregation
The following example uses the OpenSearch Dashboards sample ecommerce data. To add the sample data, log in to OpenSearch Dashboards, choose Home, and then choose Try our sample data. For Sample eCommerce orders, choose Add data.
This example uses the avg aggregation to find the average value of the taxful_total_price field:
GET opensearch_dashboards_sample_data_ecommerce/_search
{
  "size": 0,
  "aggs": {
    "avg_taxful_total_price": {
      "avg": {
        "field": "taxful_total_price"
      }
    }
  }
}
The response includes an aggregations block containing the calculated average value:
{
  "took" : 1,
  "timed_out" : false,
  "_shards" : {
    "total" : 1,
    "successful" : 1,
    "skipped" : 0,
    "failed" : 0
  },
  "hits" : {
    "total" : {
      "value" : 4675,
      "relation" : "eq"
    },
    "max_score" : null,
    "hits" : [ ]
  },
  "aggregations" : {
    "avg_taxful_total_price" : {
      "value" : 75.05542864304813
    }
  }
}
Aggregation types
There are three main aggregation types:
- Metric aggregations – Calculate metrics such as
sum,min,max, andavgon numeric fields. - Bucket aggregations – Sort query results into groups based on some criteria.
- Pipeline aggregations – Pipe the output of one aggregation as an input to another.
Metric aggregations
Metric aggregations calculate statistics on numeric field values:
avg– Calculate average values.cardinality– Count unique values.extended_stats– Get comprehensive statistics including standard deviation.max– Find maximum values.min– Find minimum values.percentile– Calculate percentiles (for example, median, 95th percentile).stats– Get basic statistics (count,sum,min,max, andavg).sum– Calculate sum of values.value_count– Count non-null values.
For a complete list of metric aggregations, see Metric aggregations.
Bucket aggregations
Bucket aggregations group documents into buckets based on field values, ranges, or other criteria:
terms– Group by unique field values.date_histogram– Group by time intervals.histogram– Group by numeric intervals.range– Group by numeric ranges.filter– Create a single bucket matching a filter.filters– Create multiple buckets, one for each filter.missing– Group documents that are missing a field value.significant_terms– Find unusual or interesting terms in a dataset.
For a complete list of bucket aggregations, see Bucket aggregations.
Pipeline aggregations
Pipeline aggregations process the output of other aggregations:
avg_bucket– Calculate the average across buckets.cumulative_sum– Calculate a running total across buckets.bucket_sort– Sort and limit the number of buckets returned.
For a complete list of pipeline aggregations, see Pipeline aggregations.
Nested aggregations
Aggregations within aggregations are called nested aggregations or subaggregations.
Metric aggregations produce simple results and can’t contain nested aggregations.
Bucket aggregations produce buckets of documents that you can nest in other aggregations. You can perform complex analysis on your data by nesting metric and bucket aggregations within bucket aggregations.
General nested aggregation syntax
{
  "aggs": {
    "name": {
      "type": {
        "data"
      },
      "aggs": {
        "nested": {
          "type": {
            "data"
          }
        }
      }
    }
  }
}
The inner aggs keyword begins a new nested aggregation. The syntax of the parent aggregation and the nested aggregation is the same. Nested aggregations run in the context of the preceding parent aggregations.
Nested aggregation example
The following example uses the OpenSearch Dashboards sample ecommerce data to group orders by category and calculate the average price within each category. This query returns the top 5 categories sorted in descending alphabetical order:
GET opensearch_dashboards_sample_data_ecommerce/_search
{
  "size": 0,
  "aggs": {
    "categories": {
      "terms": {
        "field": "category.keyword",
        "size": 5,
        "order": {
          "_key": "desc"
        }
      },
      "aggs": {
        "avg_price": {
          "avg": {
            "field": "taxful_total_price"
          }
        }
      }
    }
  }
}
The response includes buckets for each category, sorted in descending alphabetical order, with the average price calculated within each bucket:
{
  "took" : 22,
  "timed_out" : false,
  "_shards" : {
    "total" : 1,
    "successful" : 1,
    "skipped" : 0,
    "failed" : 0
  },
  "hits" : {
    "total" : {
      "value" : 4675,
      "relation" : "eq"
    },
    "max_score" : null,
    "hits" : [ ]
  },
  "aggregations" : {
    "categories" : {
      "doc_count_error_upper_bound" : 0,
      "sum_other_doc_count" : 572,
      "buckets" : [
        {
          "key" : "Women's Shoes",
          "doc_count" : 1136,
          "avg_price" : {
            "value" : 92.8513836927817
          }
        },
        {
          "key" : "Women's Clothing",
          "doc_count" : 1903,
          "avg_price" : {
            "value" : 70.99312352207042
          }
        },
        {
          "key" : "Women's Accessories",
          "doc_count" : 830,
          "avg_price" : {
            "value" : 73.28953313253012
          }
        },
        {
          "key" : "Men's Shoes",
          "doc_count" : 944,
          "avg_price" : {
            "value" : 97.24356130826271
          }
        },
        {
          "key" : "Men's Clothing",
          "doc_count" : 2024,
          "avg_price" : {
            "value" : 73.81122043292984
          }
        }
      ]
    }
  }
}
For more examples of nested aggregations, see Pipeline aggregations.
You can also pair your aggregations with search queries to narrow down the data you’re analyzing before aggregating. If you don’t add a query, OpenSearch implicitly uses the match_all query.
Using aggregations
You can use aggregations through the OpenSearch API or through the OpenSearch Dashboards UI.
Using the aggregations API
You can run aggregation requests from the command line using a tool such as cURL or from the OpenSearch Dashboards Dev Tools console. For more information about using the Dev Tools console, see Running queries in the Dev Tools console.
See the Example aggregation and Nested aggregation example sections for sample API requests and responses. For detailed syntax and parameters for each aggregation type, see the type-specific documentation pages listed in the Aggregation types section.
Using aggregations in OpenSearch Dashboards
Aggregations power visualizations in OpenSearch Dashboards. When you create a visualization, OpenSearch Dashboards automatically generates aggregation API queries based on your selections—you don’t need to write these queries manually.
How aggregations appear in visualizations
The aggregation types described in this document correspond to options in visualizations:
- Metric aggregations appear in the Metrics dropdown and become Y-axis values in charts. Common options include
Count,Average,Sum,Min, andMax. - Bucket aggregations appear in the Buckets dropdown and become X-axis groupings, slice dimensions in pie charts, or row/column splits. Common options include
Terms,Date Histogram,Histogram, andRange. - Date histograms create time-series line charts and area charts by grouping data into time intervals.
Creating a visualization using aggregations
To create a bar chart showing average order value by category, follow these steps:
- In OpenSearch Dashboards, on the top menu, select Visualize.
- Select Create visualization.
- Select Vertical Bar and then select [eCommerce] Orders.
- Set the time range:
- In the upper-right corner, select the time range selector (calendar icon).
- Select Last 7 days.
- Configure the Y-axis:
- In the Metrics panel, select Y-axis.
- From the Aggregation dropdown list, select Average.
- From the Field dropdown list, choose the
taxful_total_pricefield.
- Configure the X-axis:
- In the Buckets panel, select Add > X-axis.
- From the Aggregation dropdown list, select Terms.
- From the Field dropdown list, select the
category.keywordfield.
- Select Update to view your visualization, as shown in the following image.
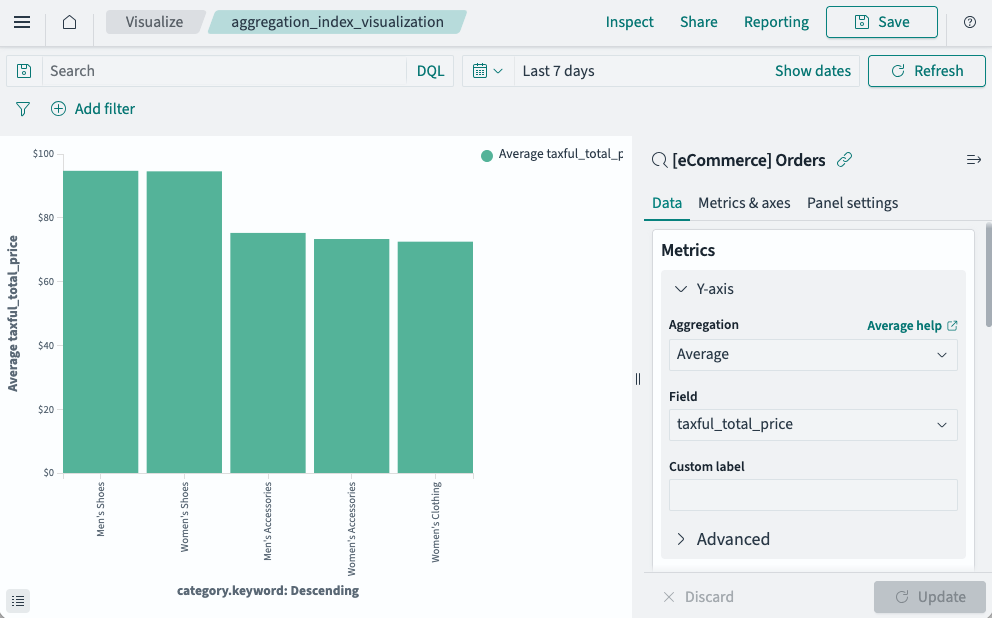
This creates a nested aggregation in which the Average metric is nested inside the Terms bucket. Internally, OpenSearch Dashboards generates an aggregation query matching the structure shown in the preceding Nested aggregation example.
For detailed information about creating visualizations using aggregations, see Building data visualizations.
Aggregations on text fields
By default, OpenSearch doesn’t support aggregations on a text field. Because text fields are tokenized, an aggregation on a text field has to reverse the tokenization process back to its original string and then formulate an aggregation based on that. This kind of an operation consumes significant memory and degrades cluster performance.
While you can enable aggregations on text fields by setting the fielddata parameter to true in the mapping, the aggregations are still based on the tokenized words and not on the raw text.
We recommend keeping a raw version of the text field as a keyword field that you can aggregate on.
The following example creates a product_name field with a keyword subfield named raw. You can perform aggregations on product_name.raw instead of on product_name:
PUT products
{
  "mappings": {
    "properties": {
      "product_name": {
        "type": "text",
        "fielddata": true,
        "fields": {
          "raw": {
            "type": "keyword"
          }
        }
      }
    }
  }
}
For more information about mappings, see Mappings.
Limitations
Because aggregators are processed using the double data type for all values, long values of 253 and greater are approximate.
Next steps
- Explore metric aggregations to calculate statistics on your data.
- Learn about bucket aggregations to group and analyze data by categories, ranges, or time intervals.
- Discover pipeline aggregations for advanced analysis using the output of other aggregations.
- Create visualizations in OpenSearch Dashboards using aggregations.