Per cluster metrics monitors
A per cluster metrics monitor runs a cluster API request on a schedule and evaluates the response using a trigger condition. Use it to generate alerts about the state of a cluster, for example, when:
- Cluster health reaches yellow or red status.
- Cluster-level metrics, such as CPU usage and JVM memory usage, reach specified thresholds.
- Node-level metrics, such as available disk space, JVM memory usage, and CPU usage, reach specified thresholds.
- The total number of documents stored reaches a specified threshold.
Creating a per cluster metrics monitor
The following example creates a monitor that generates an alert when the cluster health status is not green.
To create the monitor, follow these steps:
- On the top menu, go to OpenSearch Plugins > Alerting.
- Select the Monitors tab, and then select Create monitor.
- In Monitor details, enter a Monitor name, such as
Cluster health, and select Per cluster metrics monitor. Optionally, change the Schedule. By default, the monitor runs every minute. - In Select data, keep the local cluster selected. To monitor remote clusters, select them in Select clusters. For more information, see Monitoring remote clusters.
- In Query, in Request type, select Cluster health. Optionally, in Path parameters, enter path parameters to filter the API response, for example, a comma-separated list of index names. To view the API response, select Preview query.
- In Triggers, select Add trigger, and then configure the trigger:
- Trigger name: Enter
Cluster health is not green. - Severity level: Keep 1 (Highest).
- Trigger condition: Keep the default condition for the selected request type,
ctx.results[0].status != "green". The condition is a Painless script that evaluates the API response. To test the condition, select Preview condition response.
- Trigger name: Enter
- Optionally, in Actions, add an action that sends a notification when the trigger condition is met. For more information, see Actions.
- Select Create.
If the cluster health status is yellow or red, the monitor generates an alert in the Active state. For example, a single-node cluster that contains indexes with replicas has a yellow status because the replicas cannot be assigned.
A per cluster metrics monitor supports up to 10 triggers. For the variables that you can use in trigger conditions, see Trigger variables.
Creating a per cluster metrics monitor using the API
To create the monitor from the preceding example using the API, send the following request:
POST _plugins/_alerting/monitors
{
  "type": "monitor",
  "monitor_type": "cluster_metrics_monitor",
  "name": "Cluster health",
  "enabled": true,
  "schedule": {
    "period": {
      "interval": 1,
      "unit": "MINUTES"
    }
  },
  "inputs": [
    {
      "uri": {
        "api_type": "CLUSTER_HEALTH",
        "path": "_cluster/health",
        "path_params": ""
      }
    }
  ],
  "triggers": [
    {
      "query_level_trigger": {
        "name": "Cluster health is not green",
        "severity": "1",
        "condition": {
          "script": {
            "source": "ctx.results[0].status != \"green\"",
            "lang": "painless"
          }
        },
        "actions": []
      }
    }
  ]
}
For more information about the monitor APIs, see Alerting API.
Supported APIs
A per cluster metrics monitor can call the following APIs. The api_type column lists the value to use in the inputs.uri.api_type field when you create the monitor using the API. The APIs support path parameters, such as a comma-separated list of index names, but not query parameters.
| API | api_type | Request type in OpenSearch Dashboards |
|---|---|---|
| Cluster Health | CLUSTER_HEALTH | Cluster health |
| Cluster Settings | CLUSTER_SETTINGS | Cluster settings |
| Cluster Stats | CLUSTER_STATS | Cluster stats |
| CAT Indices | CAT_INDICES | List indices |
| CAT Pending Tasks | CAT_PENDING_TASKS | List pending tasks |
| CAT Recovery | CAT_RECOVERY | List index and shard recoveries |
| CAT Shards | CAT_SHARDS | List shards |
| CAT Snapshots | CAT_SNAPSHOTS | List snapshots |
| CAT Tasks | CAT_TASKS | List tasks |
| Nodes Stats | NODES_STATS | Not available. Use the API. |
Restricting API fields
To restrict the APIs and response fields that can be used in per cluster metrics monitors, modify the supported_json_payloads.json file inside the Alerting plugin. The file functions as an allow list. By default, all supported APIs and their response fields can be used in monitors and trigger conditions.
If you modify the file, per cluster metrics monitors can be created only for the APIs that the file lists, and trigger conditions can use only the fields that the file lists. For example, the following entry allows monitors for the Cluster Stats API and trigger conditions that use the indices.shards.total and indices.shards.index.shards.min fields:
"/_cluster/stats": {
  "indices": [
    "shards.total",
    "shards.index.shards.min"
  ]
}
Monitoring remote clusters
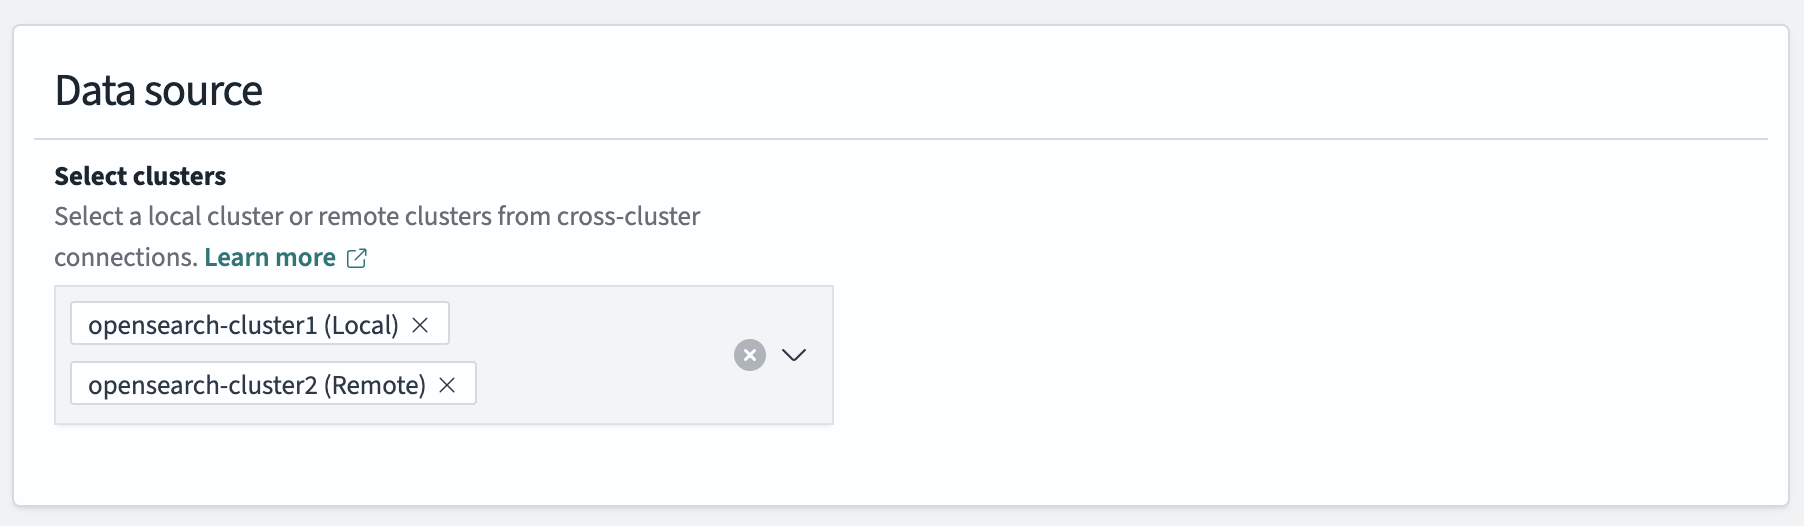
A per cluster metrics monitor can call an API on multiple clusters. In OpenSearch Dashboards, select the clusters in Select clusters. Using the API, list the clusters in the inputs.uri.clusters field, for example, "clusters": ["cluster-1", "cluster-2"].
When a monitor calls an API on multiple clusters, ctx.results[0] contains a response for each cluster, keyed by cluster name. The following trigger condition generates an alert when the health status of any of the clusters is not green:
for (cluster in ctx.results[0].keySet()) if (ctx.results[0][cluster].status != "green") return true
To create a cross-cluster monitor in OpenSearch Dashboards, you need the following permissions: cluster:admin/opensearch/alerting/remote/indexes/get, indices:admin/resolve/index, cluster:monitor/health, and indices:admin/mappings/get.
The following image shows a per cluster metrics monitor that calls the Cluster Health API on two clusters.
Limitations
Per cluster metrics monitors have the following limitations:
- The cluster must be in a state in which the monitor can run and its actions can be performed.
- Removing resource permissions from a user does not stop that user’s existing monitors for that resource from running.
- Users with permissions to create monitors are not prevented from creating monitors for resources that they don’t have permissions for. However, those monitors don’t run.