Getting started with log analytics
In this tutorial, you’ll send Apache access logs to OpenSearch, query them using Piped Processing Language (PPL), and add a visualization of the results to a dashboard.
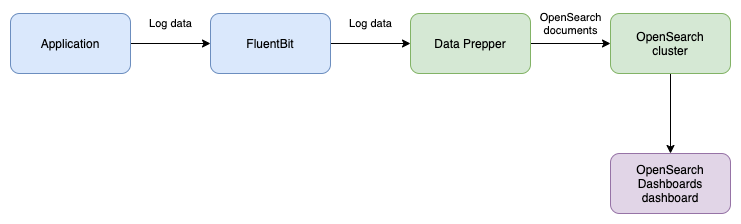
The tutorial uses the following components:
- Fluent Bit collects log lines from a file and sends them to Data Prepper.
- OpenSearch Data Prepper parses each log line into fields and writes the result to an OpenSearch index.
- OpenSearch Dashboards queries and visualizes the indexed logs using Event analytics and Operational panels.
The following diagram shows how log data flows from an application to OpenSearch.
Prerequisites
To run the tutorial, you need Docker and Git. The tutorial starts OpenSearch on port 9200 and OpenSearch Dashboards on port 5601, so stop any other OpenSearch cluster that uses these ports.
Step 1: Download the example
The example is located in the examples/log-ingestion/ directory of the Data Prepper repository and contains the following files.
| File | Description |
|---|---|
docker-compose.yaml | Defines the Fluent Bit (fluent-bit), single-node OpenSearch cluster (opensearch), and OpenSearch Dashboards (dashboards) containers. |
docker-compose-dataprepper.yaml | Defines the Data Prepper (data-prepper) container. |
fluent-bit.conf | Configures Fluent Bit to read test.log and send each new line to Data Prepper. |
log_pipeline.yaml | Defines the Data Prepper pipeline, which parses each log line using the COMMONAPACHELOG grok pattern and writes it to the apache_logs index. |
test.log | The log file that Fluent Bit reads. |
The example sets the OpenSearch admin password to Developer@123 in both docker-compose.yaml and log_pipeline.yaml. To use a different password, change it in both files before you start the containers.
Clone the Data Prepper repository and go to the example directory:
git clone https://github.com/opensearch-project/data-prepper.git
cd data-prepper/examples/log-ingestion
Step 2: Add a timestamp to each log event
Operational panels filter every visualization by time, so the index must contain a field of the date type. The log lines contain a timestamp, but the grok pattern stores it as text. To add a date field, add a date processor to the processor list in log_pipeline.yaml, after the grok processor. The updated file contains the following pipeline:
log-pipeline:
  source:
    http:
      ssl: false
  processor:
    - grok:
        match:
          log: [ "%{COMMONAPACHELOG}" ]
    - date:
        from_time_received: true
        destination: "@timestamp"
  sink:
    - opensearch:
        hosts: [ "https://opensearch:9200" ]
        insecure: true
        username: admin
        password: Developer@123
        index: apache_logs
The date processor sets the @timestamp field to the time at which Data Prepper receives each event. Using the time received keeps the sample events, whose log lines are from 2021, within the default time range of the OpenSearch Dashboards pages used in this tutorial.
Step 3: Start the containers
Start the containers using both Docker Compose files in a single command:
docker compose -f docker-compose.yaml -f docker-compose-dataprepper.yaml up -d
Both files must be specified in the same command so that all four containers join the same Docker network. If you start the files separately, Fluent Bit cannot reach Data Prepper and Data Prepper cannot reach OpenSearch, so no data is indexed.
Wait until Data Prepper is ready to receive data. Run the following command until the output contains a line similar to Started http source on port 2021:
docker logs data-prepper 2>&1 | grep "Started http source"
Data Prepper starts the pipeline only after it connects to OpenSearch, which can take a minute or longer. If you write log data before Data Prepper is ready, Fluent Bit can discard the data after it fails to deliver it.
Step 4: Send log data
Append the following log lines to test.log:
cat >> test.log <<'EOF'
63.173.168.120 - - [04/Nov/2021:15:07:25 -0500] "GET /search/tag/list HTTP/1.0" 200 5003
10.0.0.5 - - [04/Nov/2021:15:08:01 -0500] "GET /index.html HTTP/1.1" 200 1024
10.0.0.7 - - [04/Nov/2021:15:08:12 -0500] "POST /login HTTP/1.1" 401 512
10.0.0.9 - - [04/Nov/2021:15:09:44 -0500] "GET /missing HTTP/1.1" 404 210
10.0.0.5 - - [04/Nov/2021:15:10:02 -0500] "GET /cart HTTP/1.1" 500 98
EOF
Fluent Bit collects the log lines and sends them to Data Prepper. To confirm delivery, run docker logs fluent-bit. The output contains a line similar to the following:
[2026/10/27 22:51:53.623] [ info] [output:http:http.0] data-prepper:2021, HTTP status=200
Step 5: Search the data in OpenSearch
Data Prepper parses each log line and writes it to the apache_logs index, as defined in log_pipeline.yaml. Data Prepper sends documents to OpenSearch in batches, so the documents can take a minute or longer to appear. To view the first document, run the following command:
curl -X GET -u 'admin:Developer@123' -k 'https://localhost:9200/apache_logs/_search?pretty&size=1'
The response contains the parsed log data, including the @timestamp field added by the date processor. The date field, which contains the time at which Fluent Bit read the line in epoch seconds, is added by the Fluent Bit HTTP output:
{
  "took" : 6,
  "timed_out" : false,
  "_shards" : {
    "total" : 1,
    "successful" : 1,
    "skipped" : 0,
    "failed" : 0
  },
  "hits" : {
    "total" : {
      "value" : 5,
      "relation" : "eq"
    },
    "max_score" : 1.0,
    "hits" : [
      {
        "_index" : "apache_logs",
        "_id" : "B0Oif6EBGoQmkf_UZoQh",
        "_score" : 1.0,
        "_source" : {
          "date" : 1.793142650955058E9,
          "log" : "63.173.168.120 - - [04/Nov/2021:15:07:25 -0500] \"GET /search/tag/list HTTP/1.0\" 200 5003",
          "request" : "/search/tag/list",
          "auth" : "-",
          "ident" : "-",
          "response" : "200",
          "bytes" : "5003",
          "clientip" : "63.173.168.120",
          "verb" : "GET",
          "httpversion" : "1.0",
          "timestamp" : "04/Nov/2021:15:07:25 -0500",
          "@timestamp" : "2026-10-27T23:10:51.594Z"
        }
      }
    ]
  }
}
Step 6: Create a dashboard
Go to http://localhost:5601 and log in as the admin user using the password Developer@123. Then create an operational panel to hold your visualization:
- On the top menu, go to Observability > Dashboards.
- Select Create Dashboard.
- In Name, enter
Web traffic, and then select Create.
Step 7: Query and visualize the logs
Use Event analytics to query the logs and save a visualization to the dashboard:
- On the top menu, go to Observability > Logs, and then select Event Explorer.
-
In the query editor, enter the following PPL query, which counts the log events for each HTTP method:
source = apache_logs | stats count() by verb - Select Run. The Events tab lists the results. If no results appear, use the time picker to select a time range that includes the time at which you sent the log data.
- Select the Visualizations tab. The results are displayed as a vertical bar chart, with one bar for each HTTP method.
- Select Save. In Custom operational dashboards/application, select Web traffic. In Name, enter
Requests by method, and then select Save. - On the top menu, go to Observability > Dashboards, and then select Web traffic. The dashboard contains the Requests by method visualization.
Step 8: Clean up
To stop the containers and delete their data, run the following command:
docker compose -f docker-compose.yaml -f docker-compose-dataprepper.yaml down -v
Next steps
- To learn how logs, traces, and metrics reach OpenSearch, see Ingesting observability data.
- To learn more about PPL queries and visualizations, see Event analytics.
- To explore logs in an Observability workspace, see Logs.
- To learn more about Data Prepper pipelines, see Ingesting log data into OpenSearch.