Per query and per bucket monitors
Per query and per bucket monitors run a query on a schedule and evaluate the results using trigger conditions:
- A per query monitor evaluates the query result as a whole. For example, it can generate an alert when the number of matching documents is above a threshold. A trigger in a per query monitor has at most one active alert at a time.
- A per bucket monitor groups the query results into buckets using one or more fields and evaluates each bucket separately. For example, it can generate a separate alert for each host or country whose request count is above a threshold.
The examples on this page use the OpenSearch Dashboards sample web logs. To add the sample data, on the OpenSearch Dashboards home page, select Add sample data, and then select Add data on the Sample web logs card.
Creating a per query monitor
The following example creates a monitor that generates an alert when the website receives more than 100 requests in a day.
To create the monitor, follow these steps:
- On the top menu, go to OpenSearch Plugins > Alerting.
- Select the Monitors tab, and then select Create monitor.
- In Monitor details, configure the following settings:
- Monitor name: Enter
Daily web traffic. - Monitor type: Select Per query monitor.
- Monitor defining method: Select Visual editor. To write the query using query domain-specific language (DSL), select Extraction query editor instead. For more information, see Defining the query using the extraction query editor. To generate alerts from anomaly detection results, select Anomaly detector. For more information, see Pairing a monitor with an anomaly detector.
- Schedule: Keep the default, which runs the monitor every minute. To run the monitor at a specific time, select Daily, Weekly, Monthly, or Custom cron expression, and then select a time zone. For more information about cron expressions, see Cron expressions.
- Monitor name: Enter
-
In Select data, in Indexes, enter
opensearch_dashboards_sample_data_logsand press Enter. In Time field, selecttimestamp.If you use the Security plugin, you can select only indexes that you have permission to access. For more information, see Alerting security.
- In Query, configure the query:
- Metrics: Keep COUNT OF documents. To use another aggregation, such as an average or maximum of a numeric field, select Add metric.
- Time range for the last: Enter
1and select day(s). - Data filter: Optionally, select Add filter to monitor a subset of the documents.
To view the query and how long it takes to run, expand Preview query and performance. The monitor runs this query as often as the schedule specifies, so check that its performance is acceptable.
- In Triggers, select Add trigger, and then configure the trigger:
- Trigger name: Enter
More than 100 requests. - Severity level: Keep 1 (Highest).
- Trigger condition: Select IS ABOVE and enter
100.
The trigger preview shows the document count over the selected time range. For more information, see Triggers.
- Trigger name: Enter
- Optionally, in Actions, add an action that sends a notification when the trigger condition is met. Actions require a notification channel. If you don’t have one, select Manage channels to create one. For more information, see Actions.
- Select Create.
Because the sample web logs typically contain more than 100 requests in a day, the trigger condition is met and the monitor generates an alert in the Active state. To view the alert, select the Alerts tab on the Alerting page.
Creating a per bucket monitor
The following example creates a monitor that generates a separate alert for each country that sends more than 20 requests in a day.
To create the monitor, follow these steps:
- On the top menu, go to OpenSearch Plugins > Alerting.
- Select the Monitors tab, and then select Create monitor.
- In Monitor details, enter a Monitor name, such as
Daily requests by country. In Monitor type, select Per bucket monitor. In Monitor defining method, select Visual editor. - In Select data, in Indexes, enter
opensearch_dashboards_sample_data_logsand press Enter. In Time field, selecttimestamp. - In Query, configure the query:
- Metrics: Keep COUNT OF documents.
- Time range for the last: Enter
1and select day(s). - Group by: Select Add group by, and then select the
geo.srcfield. A per bucket monitor requires at least one group-by field.
- In Triggers, select Add trigger, and then configure the trigger:
- Trigger name: Enter
More than 20 requests. - Trigger conditions: In Metric, keep Count of documents. In Threshold, select IS ABOVE. In Value, enter
20. - Keyword filter: Optionally, select Add filter to evaluate only the buckets whose group-by value matches a keyword.
- Trigger name: Enter
- Optionally, in Actions, add an action that sends a notification for each bucket that meets the trigger condition.
- Select Create.
The monitor generates an alert for each country whose request count is above the threshold. Each alert includes the bucket key, for example, CN.
Defining the query using the extraction query editor
To define the query using query DSL, select Extraction query editor in Monitor defining method. Then enter the query in Query and select Run to test it. The Monitor performance panel shows how long the query takes to run and how many documents it returns.
To limit the query to the time period of each monitor run, use the {{period_end}} variable. The following query returns the number of 404 responses in the day before each monitor run:
{
  "size": 0,
  "query": {
    "bool": {
      "filter": [
        {
          "range": {
            "timestamp": {
              "gte": "{{period_end}}||-1d",
              "lte": "{{period_end}}",
              "format": "epoch_millis"
            }
          }
        },
        {
          "term": {
            "response.keyword": "404"
          }
        }
      ]
    }
  }
}
When you use the extraction query editor, you define the trigger condition using a Painless script. The following condition generates an alert when the query returns more than 5 documents:
ctx.results[0].hits.total.value > 5
To test the condition, select Preview condition response. For the variables that you can use in trigger conditions, see Monitor variables.
Pairing a monitor with an anomaly detector
To generate alerts from the results of an anomaly detector, create a per query monitor, select Anomaly detector in Monitor defining method, and then select the detector. The Anomaly detector method is not available for per bucket monitors.
Set the monitor interval to at least twice the detector interval. Otherwise, the monitor might miss anomaly results. For example, if both the monitor and the detector run every 5 minutes and you start the detector at 12:00, an anomaly detected at 12:05 might not be available for queries until 12:06. The monitor reads results from 12:00 to 12:05, so it misses that anomaly. When you create a monitor from a detector in OpenSearch Dashboards, the monitor interval is set to twice the detector interval by default.
If you change a detector’s interval, update the monitor interval as well. The monitor interval is not updated automatically.
Querying remote indexes
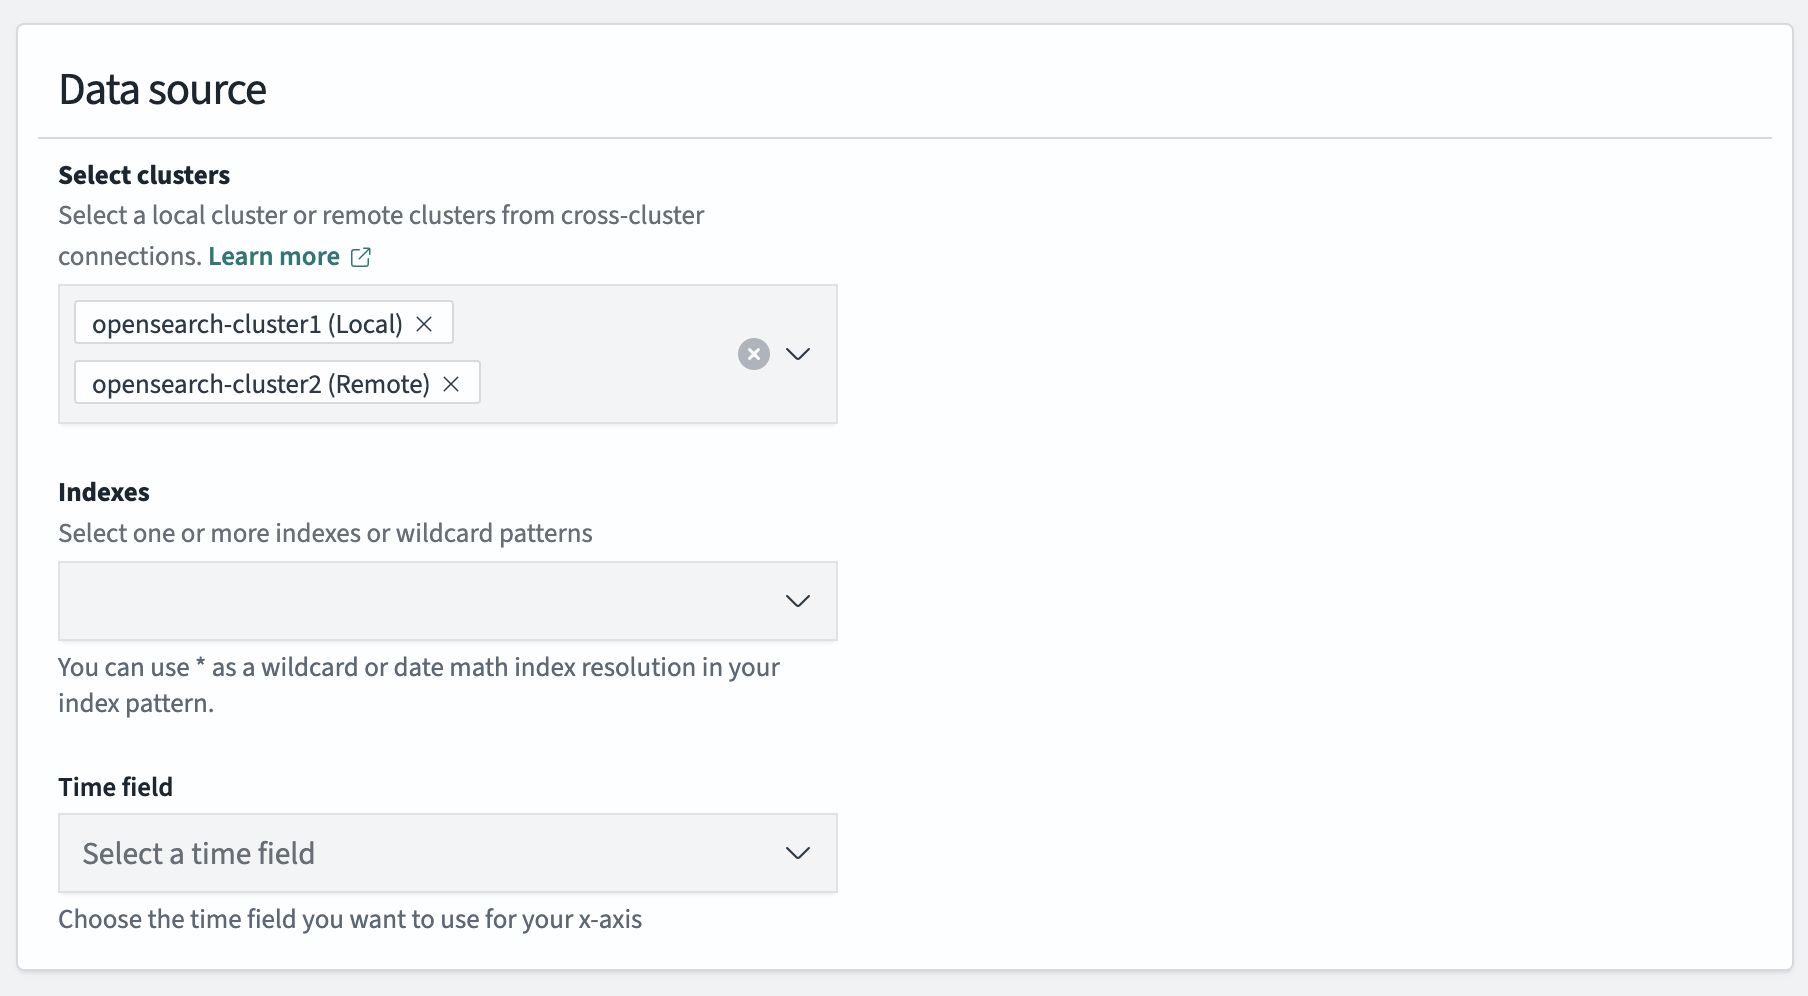
Both monitor types can query indexes on remote clusters. In Select data, select the remote clusters in Select clusters, and then select the indexes. When you define the query using the extraction query editor, specify remote indexes using the <cluster-name>:<index-name> pattern used by cross-cluster search.
To create a cross-cluster monitor in OpenSearch Dashboards, you need the following permissions: cluster:admin/opensearch/alerting/remote/indexes/get, indices:admin/resolve/index, cluster:monitor/health, and indices:admin/mappings/get.
The following image shows remote indexes selected for a per query monitor.