You're viewing version 3.7 of the OpenSearch documentation. This version is no longer maintained. For the latest version, see the current documentation. For information about OpenSearch version maintenance, see Release Schedule and Maintenance Policy.
Metric chart
A metric chart displays a single numeric value prominently, making it ideal for showing key performance indicators (KPIs) or summary statistics at a glance.
Creating a metric chart
The following example demonstrates a basic metric visualization. Before you begin, complete the prerequisites.
Basic metric chart
Start with a query that returns a numeric field:
source = opensearch_dashboards_sample_data_flights | FIELDS AvgTicketPrice
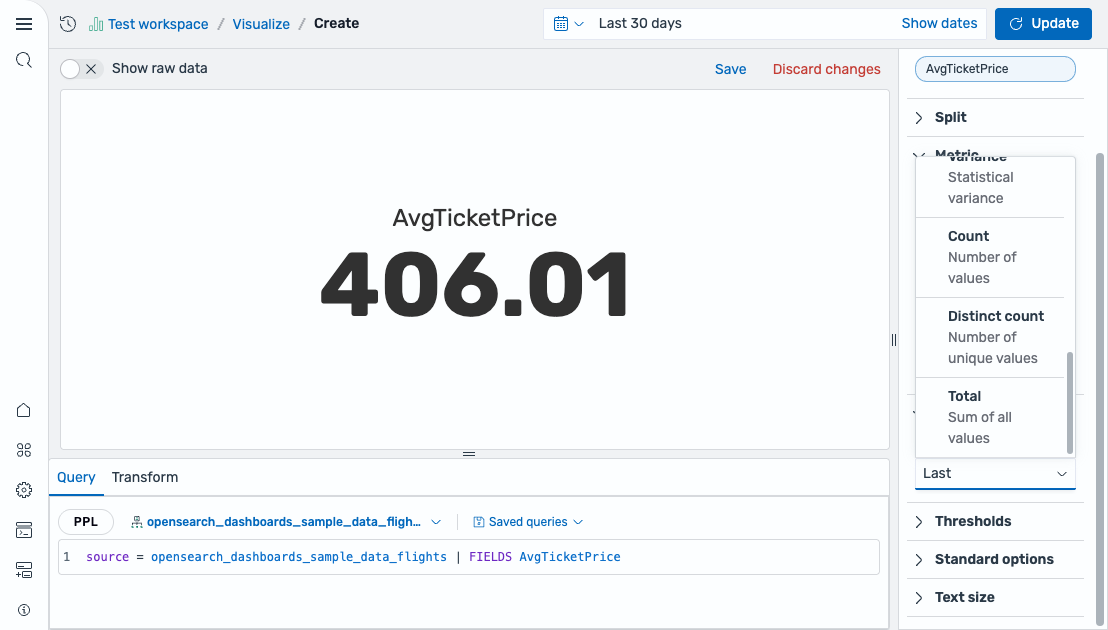
After running this query, select Metric as the chart type. The editor maps the field as follows:
- The Value field displays the
AvgTicketPricefield (using the Last calculation by default).
The result is a single large number displaying the last ticket price value, as shown in the following image.
Configuring a metric chart
You can configure the following settings in the configuration panel.
Fields
In the Fields section, configure the data fields.
| Field | Description |
|---|---|
| Value | Select a numeric field to display as the metric value. The field is reduced to a single number using the configured calculation method. |
Split
In the Split by dropdown list, select a field to split the chart into separate elements by value. For more information, see Split.
Metric
| Setting | Description |
|---|---|
| Text display | Controls what text is shown alongside the value. Supported values: Value only, Name only, Value and Name, None. |
| Color mode | Controls how threshold colors are applied to the metric. Supported values: None (no color), Value (colors the value text), Background gradient (applies a gradient background), Background solid (applies a solid background color). |
| Show percentage | When enabled, displays the value as a percentage of the max value. |
| Use threshold colors | When enabled, applies threshold colors to the metric based on the current value. |
Value options
| Setting | Description |
|---|---|
| Calculation | Determines how multiple data points are reduced to a single value. Supported values: Last *, Last, First *, First, Min, Max, Median, Variance, Distinct count, Count, Total. For more information, see Value calculations. |
Thresholds
For information about configuring thresholds, see Thresholds.
Standard options
| Setting | Description |
|---|---|
| Min | The lower bound of the metric scale (used for percentage calculations). |
| Max | The upper bound of the metric scale (used for percentage calculations). |
| Units | An optional unit label applied to the displayed value. |
Text size
| Setting | Description |
|---|---|
| Value size | Controls the font size of the displayed value. |
| Title size | Controls the font size of the metric title. |
| Percentage size | Controls the font size of the percentage display (when Show percentage is enabled). |