You're viewing version 3.7 of the OpenSearch documentation. This version is no longer maintained. For the latest version, see the current documentation. For information about OpenSearch version maintenance, see Release Schedule and Maintenance Policy.
VisBuilder
VisBuilder provides drag-and-drop visualization creation in OpenSearch Dashboards. With VisBuilder you have:
- An immediate view of your data without the need to preselect the visualization output.
- The flexibility to change visualization types and index patterns quickly.
- The ability to easily navigate between multiple screens.
When to use VisBuilder
Use VisBuilder for rapid exploration of data relationships through an intuitive drag-and-drop interface, reducing the time required to test hypotheses and explore data patterns without needing query language knowledge.
Creating a visualization using VisBuilder
The examples on this page use the Sample flight data dataset. Before you begin, complete the prerequisites.
To create a visualization using VisBuilder, follow these steps:
-
In the New Visualization dialog, select VisBuilder, as shown in the following image.
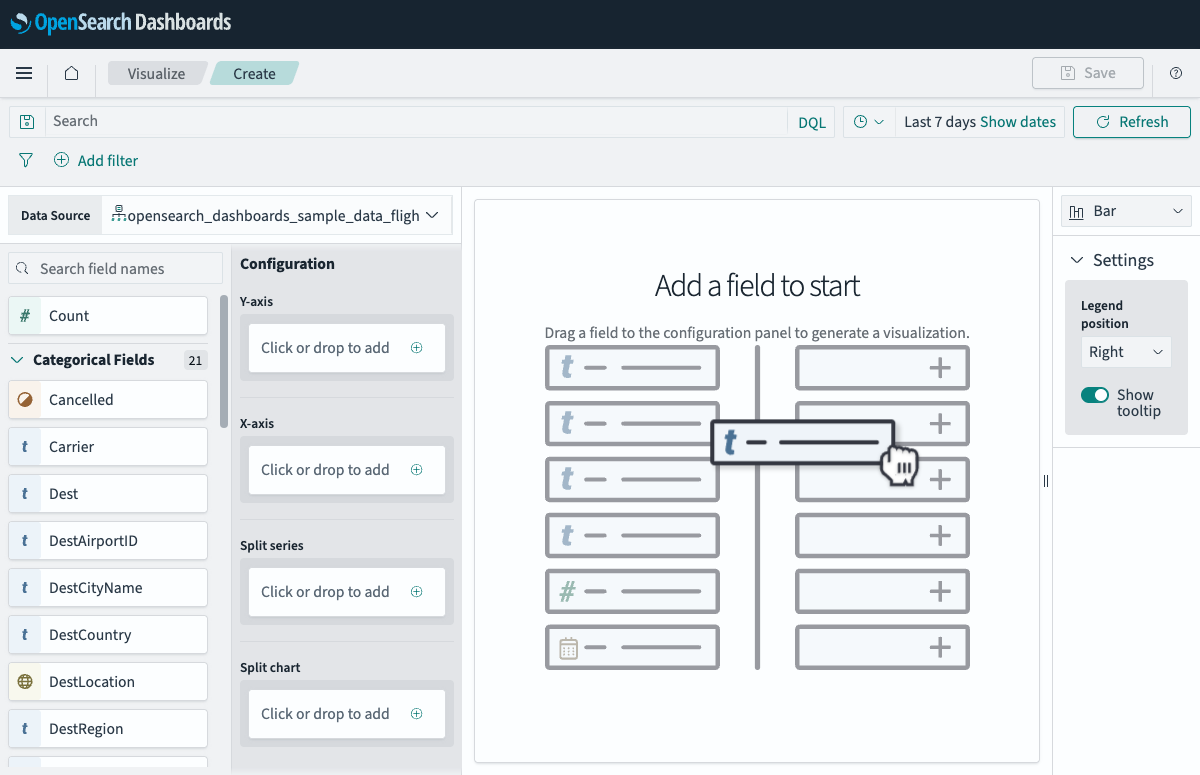
- From the Data Source dropdown, select opensearch_dashboards_sample_data_flights.
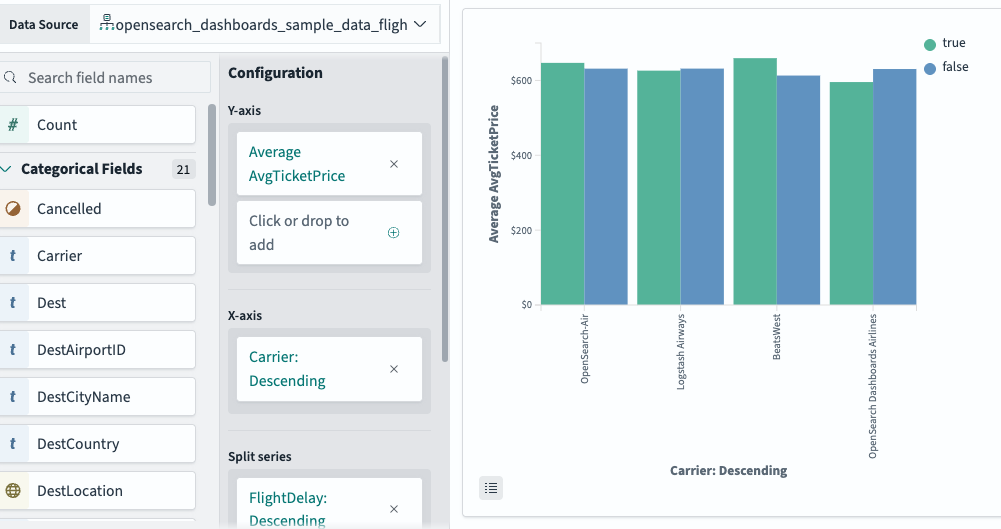
- In the Configuration panel, add fields to the chart by dragging them from the field list on the left or by selecting the + icon in each section:
- Y-axis: Select the + icon, set Aggregation to Average, and set Field to AvgTicketPrice.
- X-axis: Select the + icon, set Aggregation to Terms, set Field to Carrier, and set Order to Descending.
- Split series: Select the + icon, set Aggregation to Terms, and set Field to FlightDelay.
The chart updates automatically as you add fields. The Split series field divides each bar into color-coded subgroups. In this example, FlightDelay has two values (true and false), so each carrier shows two bars—one for delayed flights and one for non-delayed flights—in different colors, as shown in the following image.
Next steps
- To choose a different visualization type, see Visualization types.
- To add this visualization to a dashboard, see Creating dashboards.