You're viewing version 3.7 of the OpenSearch documentation. This version is no longer maintained. For the latest version, see the current documentation. For information about OpenSearch version maintenance, see Release Schedule and Maintenance Policy.
Table
A table displays query results in a tabular format with rows and columns, making it ideal for viewing raw data or summary statistics.
Creating a table
The following example demonstrates a basic table visualization. Before you begin, complete the prerequisites.
Basic table
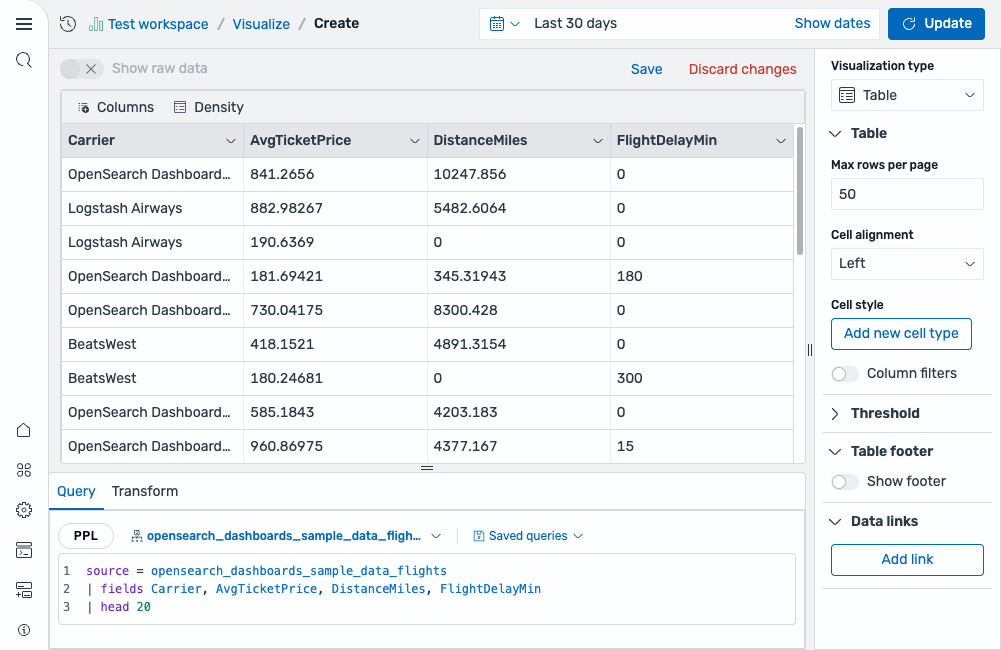
Start with a query that returns multiple fields:
source = opensearch_dashboards_sample_data_flights | fields Carrier, AvgTicketPrice, DistanceMiles, FlightDelayMin | head 20
After running this query, select Table as the chart type. The result is a table displaying the selected fields as columns, as shown in the following image.
Configuring a table
You can configure the following settings in the configuration panel.
Table
| Setting | Description |
|---|---|
| Max rows per page | Sets the maximum number of rows displayed per page. |
| Cell alignment | Controls the text alignment within cells. Supported values: Auto, Left, Center, Right. |
| Cell style | Select Add new cell type to apply custom styling to specific columns. |
| Column filters | When enabled, displays filter controls in column headers for interactive filtering. |
Threshold
For information about configuring thresholds, see Thresholds.
Table footer
| Setting | Description |
|---|---|
| Show footer | When enabled, displays a footer row with summary calculations for each column. |
Data links
Select Add link to create clickable links within table cells. Use data links to navigate to external URLs or other dashboards based on cell values.