You're viewing version 3.8 of the OpenSearch documentation. This version is no longer maintained. For the latest version, see the current documentation. For information about OpenSearch version maintenance, see Release Schedule and Maintenance Policy.
Using Dev Tools
The Dev Tools application in OpenSearch Dashboards provides tools for querying your cluster and testing queries and ingest patterns.
Navigating to Dev Tools
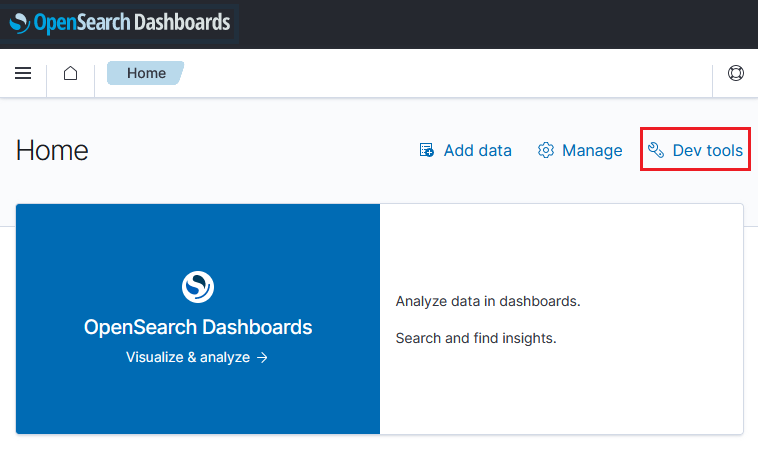
To open Dev Tools, select Dev Tools on the main OpenSearch Dashboards page, as shown in the following image.
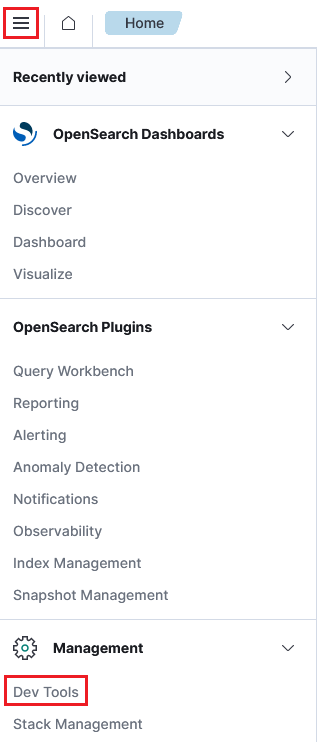
You can open Dev Tools from any other page by navigating to the main menu and selecting Management > Dev Tools, as shown in the following image.
In installations with workspaces enabled, select the code icon ( ) in the lower-left corner of the navigation panel.
Using Dev Tools
The Dev Tools application is shown in the following image.
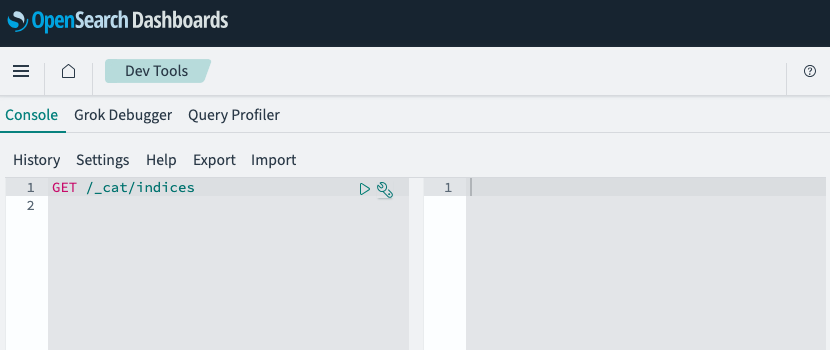
Dev Tools contains the following applications:
- Console sends Query DSL queries and other REST API requests to OpenSearch and displays the responses.
- Grok Debugger builds and tests Grok patterns against sample log data before you use them in ingest pipelines.
- Query Profiler measures how long each part of a search query takes to run so that you can identify slow components.