You're viewing version 3.8 of the OpenSearch documentation. This version is no longer maintained. For the latest version, see the current documentation. For information about OpenSearch version maintenance, see Release Schedule and Maintenance Policy.
Index rollups
Uncompressed time-series data eventually increases storage costs, strains cluster health, and slows down aggregations. Index rollup mitigates these effects by periodically compressing old data into summarized indexes with reduced granularity.
You pick the fields that interest you and use index rollup to create a new index with only those fields, aggregated into coarser time buckets. You can store months or years of historical data at a fraction of the cost with the same query performance.
For example, say you collect CPU consumption data every five seconds and store it on a hot node. Instead of moving older data to a read-only warm node, you can progressively compress this data with a 10% decrease in its interval every week. Or you could save only the average CPU consumption per day.
You can use index rollup in three ways:
- Use the Index Rollup API for an on-demand index rollup job that operates on an index that’s not being actively ingested, such as a rolled-over index. For example, you can perform an index rollup operation to aggregate data collected at a 5-minute interval into a weekly average for trend analysis.
- Use the OpenSearch Dashboards UI to create an index rollup job that runs on a defined schedule. Or you can configure the job to roll up your indexes as they are being ingested. For example, you can continuously roll up Logstash indexes from a five second interval to a one hour interval.
- Specify the index rollup job as an ISM action as a part of complete index management. This enables you to trigger a rollup after an event such as a rollover, index age reaching a certain point, index becoming read-only, and so on. You can also have rollover and index rollup jobs running in sequence, where the rollover first moves the current index to a warm node and then the index rollup job creates a new index with the minimized data on the hot node.
Configuring a rollup job
A rollup job reads from a source index and writes summarized documents to a target index. The source index is unchanged, and you cannot change either index selection after the job is created.
A job aggregates the source documents on a timestamp field, using either a fixed interval, where every bucket is the same length, or a calendar interval, which follows calendar entities such as months and can be unequal. You can group by additional fields—terms aggregation for any field type and histogram aggregation for numeric fields—and save avg, sum, max, min, value_count, and cardinality metrics for numeric fields.
Choose the fields to group by carefully. Highly granular fields produce nearly as many rolled-up documents as source documents and save little space. The order of the fields matters: group by the fields with the fewest buckets first. For a dataset of demographics by city, for example, group by city and save the demographics as metrics.
A job runs on a fixed interval or on a schedule that you define with a cron expression, and processes a number of pages per run that trades run time against memory. Add an execution delay to give ingestion time to finish: with a delay of 10 minutes, the run that rolls up the hour from 1 PM to 2 PM starts at 2:10 PM. Mark the job as continuous to roll up data as it is ingested rather than in one pass.
To create a job, use the Index rollups API or the steps in Creating a rollup job.
Searching the target index
Search the target index with the _search API. The query must match the constraints of the target index. A terms aggregation on a field that you did not group by, or an aggregation on a metric that you did not save, is rejected with 400.
An avg sub-aggregation nested under a date_histogram returns 400 with a script_exception on a rollup index. Use sum and value_count and divide them, or nest the avg under a terms aggregation instead.
You cannot access the internal structure of the documents in the target index. OpenSearch rewrites the query to suit the target index so that you can use the same query against the source and target indexes.
To query the target index, set size to 0:
GET {target_index}/_search
{
  "size": 0,
  "query": {
    "match_all": {}
  },
  "aggs": {
    "avg_cpu": {
      "avg": {
        "field": "cpu_usage"
      }
    }
  }
}
Consider a scenario where you collect rolled up data from 1 PM to 9 PM in hourly intervals and live data from 7 PM to 11 PM in minutely intervals. If you execute an aggregation over these in the same query, for 7 PM to 9 PM, you see an overlap of both rolled up data and live data because they get counted twice in the aggregations.
Cardinality metric
Introduced 3.5
The cardinality metric enables memory-efficient tracking of unique counts in rolled-up data using the HyperLogLog++ (HLL++) algorithm. This is ideal for high-cardinality fields like user IDs, IP addresses, or session IDs where storing all unique values would be prohibitively expensive.
Configuration
When defining a cardinality metric in a rollup job, you can specify the following parameter.
| Parameter | Data type | Description |
|---|---|---|
precision_threshold | Integer | Controls the trade-off between accuracy and memory usage. Higher values provide more accuracy but use more memory. Use a value between 100 and 40,000; values outside that range are accepted without an error but are not supported. Default is 3,000. |
You can specify the precision_threshold parameter in the cardinality object as follows:
{
  "metrics": [
    {
      "source_field": "user_id",
      "metrics": [
        {
          "cardinality": {
            "precision_threshold": 10000
          }
        }
      ]
    }
  ]
}
Querying cardinality metrics
You can query cardinality metrics on rollup indexes in the same way you would on source indexes:
GET {rollup_index}/_search
{
  "size": 0,
  "aggs": {
    "unique_users": {
      "cardinality": {
        "field": "user_id"
      }
    }
  }
}
When querying rollup indexes, any precision_threshold specified in the query is ignored. The system always uses the precision threshold configured when the rollup job was created. This ensures consistency with the stored HLL sketches.
Example: Tracking unique visitors
This example creates a rollup job that tracks the number of unique visitors per hour. First create the source index:
PUT web_logs
{
  "mappings": {
    "properties": {
      "timestamp": { "type": "date" },
      "visitor_id": { "type": "keyword" },
      "page_views": { "type": "integer" }
    }
  }
}
Then create the rollup job:
PUT _plugins/_rollup/jobs/visitor_rollup
{
  "rollup": {
    "description": "Unique visitors per hour",
    "enabled": true,
    "schedule": {
      "interval": {
        "period": 1,
        "unit": "Hours"
      }
    },
    "source_index": "web_logs",
    "target_index": "web_logs_hourly",
    "page_size": 1000,
    "dimensions": [
      {
        "date_histogram": {
          "source_field": "timestamp",
          "fixed_interval": "1h"
        }
      }
    ],
    "metrics": [
      {
        "source_field": "visitor_id",
        "metrics": [
          {
            "cardinality": {
              "precision_threshold": 10000
            }
          }
        ]
      },
      {
        "source_field": "page_views",
        "metrics": [
          {
            "sum": {}
          }
        ]
      }
    ]
  }
}
A rollup job creates its target index on its first run, which happens once the configured interval elapses. Until then, searching the target index returns index_not_found_exception. To check whether a job has run, send GET _plugins/_rollup/jobs/visitor_rollup/_explain: a rollup_metadata of null means the job has not run yet.
Query the rollup index:
GET web_logs_hourly/_search
{
  "size": 0,
  "aggs": {
    "hourly_stats": {
      "date_histogram": {
        "field": "timestamp",
        "fixed_interval": "1h"
      },
      "aggs": {
        "unique_visitors": {
          "cardinality": {
            "field": "visitor_id"
          }
        },
        "total_page_views": {
          "sum": {
            "field": "page_views"
          }
        }
      }
    }
  }
}
Multi-tier rollups
Introduced 3.5
Multi-tier rollups allow you to create rollup-of-rollup jobs, enabling progressive data granularity reduction over time. This is useful for long-term data retention strategies where you want to keep fine-grained data for recent periods and increasingly coarse-grained data for older periods.
With multi-tier rollups, you can create a hierarchy of rollup jobs:
Raw Data (5-second intervals)
    ↓ Tier 1 Rollup
Hourly Rollup (1-hour intervals)
    ↓ Tier 2 Rollup
Daily Rollup (1-day intervals)
    ↓ Tier 3 Rollup
Weekly Rollup (1-week intervals)
Each tier uses the previous tier’s rollup index as its source, progressively reducing storage requirements while maintaining the ability to query the data.
Prerequisites
For multi-tier rollups to work correctly, you must fulfill the following prerequisites:
- All tiers must use the same dimension fields, and the field names and types must match.
- Each tier’s interval must be a multiple of the previous tier’s interval, for example,
5m→1h→1d. - All tiers must use the same
precision_thresholdvalue if they use cardinality metrics. - The source index for the second and subsequent tiers must be a rollup index created by a previous tier.
- The source tier must complete at least one rollup execution before you create the next tier. Creating a rollup job from an empty rollup index succeeds but produces unexpected results.
Example: Two-tier rollup strategy
This example demonstrates a two-tier rollup for Internet of Things (IoT) sensor data. It consists of Tier 1 and Tier 2:
- Both tiers use identical dimension fields:
timestamp,sensor_id,location. - Both tiers use identical metric fields:
temperature(avg/max/min),device_id(cardinality). - The cardinality
precision_thresholdis the same in both tiers (10000). - Tier 2 uses
sensor_data_hourly(the output of Tier 1) as its source.
Create the source index and add a few documents to it:
PUT sensor_data
{
  "mappings": {
    "properties": {
      "timestamp": { "type": "date" },
      "sensor_id": { "type": "keyword" },
      "location": { "type": "keyword" },
      "device_id": { "type": "keyword" },
      "temperature": { "type": "double" }
    }
  }
}
POST _bulk?refresh=true
{ "index": { "_index": "sensor_data" } }
{ "timestamp": "2026-01-05T08:15:00", "sensor_id": "s1", "location": "warehouse", "device_id": "d1", "temperature": 21.4 }
{ "index": { "_index": "sensor_data" } }
{ "timestamp": "2026-01-05T08:45:00", "sensor_id": "s1", "location": "warehouse", "device_id": "d1", "temperature": 22.1 }
{ "index": { "_index": "sensor_data" } }
{ "timestamp": "2026-01-05T09:10:00", "sensor_id": "s2", "location": "cold-store", "device_id": "d2", "temperature": 4.8 }
{ "index": { "_index": "sensor_data" } }
{ "timestamp": "2026-01-05T10:05:00", "sensor_id": "s2", "location": "cold-store", "device_id": "d2", "temperature": 5.2 }
Tier 1: Raw data → Hourly rollup
PUT _plugins/_rollup/jobs/sensors_hourly
{
  "rollup": {
    "description": "Hourly rollup of raw sensor data",
    "enabled": true,
    "schedule": {
      "interval": {
        "period": 1,
        "unit": "Hours"
      }
    },
    "source_index": "sensor_data",
    "target_index": "sensor_data_hourly",
    "page_size": 1000,
    "dimensions": [
      {
        "date_histogram": {
          "source_field": "timestamp",
          "fixed_interval": "1h"
        }
      },
      {
        "terms": {
          "source_field": "sensor_id"
        }
      },
      {
        "terms": {
          "source_field": "location"
        }
      }
    ],
    "metrics": [
      {
        "source_field": "temperature",
        "metrics": [
          {"avg": {}},
          {"max": {}},
          {"min": {}}
        ]
      },
      {
        "source_field": "device_id",
        "metrics": [
          {
            "cardinality": {
              "precision_threshold": 10000
            }
          }
        ]
      }
    ]
  }
}
Tier 2: Hourly rollup → Daily rollup
PUT _plugins/_rollup/jobs/sensors_daily
{
  "rollup": {
    "description": "Daily rollup of hourly sensor data",
    "enabled": true,
    "schedule": {
      "interval": {
        "period": 1,
        "unit": "Days"
      }
    },
    "source_index": "sensor_data_hourly",
    "target_index": "sensor_data_daily",
    "page_size": 1000,
    "dimensions": [
      {
        "date_histogram": {
          "source_field": "timestamp",
          "fixed_interval": "1d"
        }
      },
      {
        "terms": {
          "source_field": "sensor_id"
        }
      },
      {
        "terms": {
          "source_field": "location"
        }
      }
    ],
    "metrics": [
      {
        "source_field": "temperature",
        "metrics": [
          {"avg": {}},
          {"max": {}},
          {"min": {}}
        ]
      },
      {
        "source_field": "device_id",
        "metrics": [
          {
            "cardinality": {
              "precision_threshold": 10000
            }
          }
        ]
      }
    ]
  }
}
Each tier runs on its own interval, so sensor_data_hourly appears after the first hourly run and sensor_data_daily appears after the first daily run.
Querying multi-tier rollups
You can query any tier independently or search across multiple tiers.
Query a specific tier:
GET sensor_data_daily/_search
{
  "size": 0,
  "aggs": {
    "daily_avg_temp": {
      "date_histogram": {
        "field": "timestamp",
        "fixed_interval": "1d"
      },
      "aggs": {
        "max_temperature": {
          "max": {
            "field": "temperature"
          }
        },
        "unique_devices": {
          "cardinality": {
            "field": "device_id"
          }
        }
      }
    }
  }
}
Query across multiple tiers (using index patterns):
GET sensor_data_hourly,sensor_data_daily/_search
{
  "size": 0,
  "aggs": {
    "temperature_stats": {
      "date_histogram": {
        "field": "timestamp",
        "fixed_interval": "1d"
      },
      "aggs": {
        "max_temp": {
          "max": {
            "field": "temperature"
          }
        }
      }
    }
  }
}
Sample walkthrough
This walkthrough uses the OpenSearch Dashboards sample e-commerce data. To add it, go to the OpenSearch Dashboards home page, select Try our sample data, and then select Add data in Sample eCommerce orders.
Then run a search:
GET opensearch_dashboards_sample_data_ecommerce/_search
Example response
{
  "took": 23,
  "timed_out": false,
  "_shards": {
    "total": 1,
    "successful": 1,
    "skipped": 0,
    "failed": 0
  },
  "hits": {
    "total": {
      "value": 4675,
      "relation": "eq"
    },
    "max_score": 1,
    "hits": [
      {
        "_index": "opensearch_dashboards_sample_data_ecommerce",
        "_id": "jlMlwXcBQVLeQPrkC_kQ",
        "_score": 1,
        "_source": {
          "category": [
            "Women's Clothing",
            "Women's Accessories"
          ],
          "currency": "EUR",
          "customer_first_name": "Selena",
          "customer_full_name": "Selena Mullins",
          "customer_gender": "FEMALE",
          "customer_id": 42,
          "customer_last_name": "Mullins",
          "customer_phone": "",
          "day_of_week": "Saturday",
          "day_of_week_i": 5,
          "email": "selena@mullins-family.zzz",
          "manufacturer": [
            "Tigress Enterprises"
          ],
          "order_date": "2021-02-27T03:56:10+00:00",
          "order_id": 581553,
          "products": [
            {
              "base_price": 24.99,
              "discount_percentage": 0,
              "quantity": 1,
              "manufacturer": "Tigress Enterprises",
              "tax_amount": 0,
              "product_id": 19240,
              "category": "Women's Clothing",
              "sku": "ZO0064500645",
              "taxless_price": 24.99,
              "unit_discount_amount": 0,
              "min_price": 12.99,
              "_id": "sold_product_581553_19240",
              "discount_amount": 0,
              "created_on": "2016-12-24T03:56:10+00:00",
              "product_name": "Blouse - port royal",
              "price": 24.99,
              "taxful_price": 24.99,
              "base_unit_price": 24.99
            },
            {
              "base_price": 10.99,
              "discount_percentage": 0,
              "quantity": 1,
              "manufacturer": "Tigress Enterprises",
              "tax_amount": 0,
              "product_id": 17221,
              "category": "Women's Accessories",
              "sku": "ZO0085200852",
              "taxless_price": 10.99,
              "unit_discount_amount": 0,
              "min_price": 5.06,
              "_id": "sold_product_581553_17221",
              "discount_amount": 0,
              "created_on": "2016-12-24T03:56:10+00:00",
              "product_name": "Snood - rose",
              "price": 10.99,
              "taxful_price": 10.99,
              "base_unit_price": 10.99
            }
          ],
          "sku": [
            "ZO0064500645",
            "ZO0085200852"
          ],
          "taxful_total_price": 35.98,
          "taxless_total_price": 35.98,
          "total_quantity": 2,
          "total_unique_products": 2,
          "type": "order",
          "user": "selena",
          "geoip": {
            "country_iso_code": "MA",
            "location": {
              "lon": -8,
              "lat": 31.6
            },
            "region_name": "Marrakech-Tensift-Al Haouz",
            "continent_name": "Africa",
            "city_name": "Marrakesh"
          },
          "event": {
            "dataset": "sample_ecommerce"
          }
        }
      }
    ]
  }
}
...
Create an index rollup job. This example picks the order_date, customer_gender, geoip.city_name, geoip.region_name, and day_of_week fields and rolls them into an example_rollup target index:
PUT _plugins/_rollup/jobs/example
{
  "rollup": {
    "enabled": true,
    "schedule": {
      "interval": {
        "period": 1,
        "unit": "Minutes",
        "start_time": 1602100553
      }
    },
    "last_updated_time": 1602100553,
    "description": "An example policy that rolls up the sample ecommerce data",
    "source_index": "opensearch_dashboards_sample_data_ecommerce",
    "target_index": "example_rollup",
    "page_size": 1000,
    "delay": 0,
    "continuous": false,
    "dimensions": [
      {
        "date_histogram": {
          "source_field": "order_date",
          "fixed_interval": "60m",
          "timezone": "America/Los_Angeles"
        }
      },
      {
        "terms": {
          "source_field": "customer_gender"
        }
      },
      {
        "terms": {
          "source_field": "geoip.city_name"
        }
      },
      {
        "terms": {
          "source_field": "geoip.region_name"
        }
      },
      {
        "terms": {
          "source_field": "day_of_week"
        }
      }
    ],
    "metrics": [
      {
        "source_field": "taxless_total_price",
        "metrics": [
          {
            "avg": {}
          },
          {
            "sum": {}
          },
          {
            "max": {}
          },
          {
            "min": {}
          },
          {
            "value_count": {}
          }
        ]
      },
      {
        "source_field": "total_quantity",
        "metrics": [
          {
            "avg": {}
          },
          {
            "max": {}
          }
        ]
      }
    ]
  }
}
You can query the example_rollup index for the terms aggregations on the fields set up in the rollup job. You get back the same response that you would on the original opensearch_dashboards_sample_data_ecommerce source index:
POST example_rollup/_search
{
  "size": 0,
  "query": {
    "bool": {
      "must": {"term": { "geoip.region_name": "California" } }
    }
  },
  "aggregations": {
    "daily_numbers": {
      "terms": {
        "field": "day_of_week"
      },
      "aggs": {
        "per_city": {
          "terms": {
            "field": "geoip.city_name"
          },
          "aggregations": {
            "average quantity": {
               "avg": {
                  "field": "total_quantity"
                }
              }
            }
          },
          "total_revenue": {
            "sum": {
              "field": "taxless_total_price"
          }
        }
      }
    }
  }
}
Example response
{
  "took" : 14,
  "timed_out" : false,
  "_shards" : {
    "total" : 1,
    "successful" : 1,
    "skipped" : 0,
    "failed" : 0
  },
  "hits" : {
    "total" : {
      "value" : 281,
      "relation" : "eq"
    },
    "max_score" : null,
    "hits" : [ ]
  },
  "aggregations" : {
    "daily_numbers" : {
      "doc_count_error_upper_bound" : 0,
      "sum_other_doc_count" : 0,
      "buckets" : [
        {
          "key" : "Friday",
          "doc_count" : 59,
          "total_revenue" : {
            "value" : 4858.84375
          },
          "per_city" : {
            "doc_count_error_upper_bound" : 0,
            "sum_other_doc_count" : 0,
            "buckets" : [
              {
                "key" : "Los Angeles",
                "doc_count" : 59,
                "average quantity" : {
                  "value" : 2.305084745762712
                }
              }
            ]
          }
        },
        {
          "key" : "Saturday",
          "doc_count" : 46,
          "total_revenue" : {
            "value" : 3547.203125
          },
          "per_city" : {
            "doc_count_error_upper_bound" : 0,
            "sum_other_doc_count" : 0,
            "buckets" : [
              {
                "key" : "Los Angeles",
                "doc_count" : 46,
                "average quantity" : {
                  "value" : 2.260869565217391
                }
              }
            ]
          }
        },
        {
          "key" : "Tuesday",
          "doc_count" : 45,
          "total_revenue" : {
            "value" : 3983.28125
          },
          "per_city" : {
            "doc_count_error_upper_bound" : 0,
            "sum_other_doc_count" : 0,
            "buckets" : [
              {
                "key" : "Los Angeles",
                "doc_count" : 45,
                "average quantity" : {
                  "value" : 2.2888888888888888
                }
              }
            ]
          }
        },
        {
          "key" : "Sunday",
          "doc_count" : 44,
          "total_revenue" : {
            "value" : 3308.1640625
          },
          "per_city" : {
            "doc_count_error_upper_bound" : 0,
            "sum_other_doc_count" : 0,
            "buckets" : [
              {
                "key" : "Los Angeles",
                "doc_count" : 44,
                "average quantity" : {
                  "value" : 2.090909090909091
                }
              }
            ]
          }
        },
        {
          "key" : "Thursday",
          "doc_count" : 40,
          "total_revenue" : {
            "value" : 2876.125
          },
          "per_city" : {
            "doc_count_error_upper_bound" : 0,
            "sum_other_doc_count" : 0,
            "buckets" : [
              {
                "key" : "Los Angeles",
                "doc_count" : 40,
                "average quantity" : {
                  "value" : 2.3
                }
              }
            ]
          }
        },
        {
          "key" : "Monday",
          "doc_count" : 38,
          "total_revenue" : {
            "value" : 2673.453125
          },
          "per_city" : {
            "doc_count_error_upper_bound" : 0,
            "sum_other_doc_count" : 0,
            "buckets" : [
              {
                "key" : "Los Angeles",
                "doc_count" : 38,
                "average quantity" : {
                  "value" : 2.1578947368421053
                }
              }
            ]
          }
        },
        {
          "key" : "Wednesday",
          "doc_count" : 38,
          "total_revenue" : {
            "value" : 3202.453125
          },
          "per_city" : {
            "doc_count_error_upper_bound" : 0,
            "sum_other_doc_count" : 0,
            "buckets" : [
              {
                "key" : "Los Angeles",
                "doc_count" : 38,
                "average quantity" : {
                  "value" : 2.236842105263158
                }
              }
            ]
          }
        }
      ]
    }
  }
}
The doc_count field
The doc_count field in bucket aggregations contains the number of documents collected in each bucket. When calculating the bucket’s doc_count, the number of documents is incremented by the number of the pre-aggregated documents in each summary document. The doc_count returned from rollup searches represents the total number of matching documents from the source index. The document count for each bucket is the same whether you search the source index or the rollup target index.
Query string queries
To take advantage of shorter and more easily written strings in Query DSL, you can use query strings to simplify search queries in rollup indexes. To use query strings, add the following fields to your rollup search request:
"query": {
  "query_string": {
    "query": "field_name:field_value"
  }
}
You can only query fields that the rollup job indexed as dimensions. The following example uses a query string with a * wildcard operator to search the sensor_data_hourly rollup index for two of its location dimension values:
GET sensor_data_hourly/_search
{
  "size": 0,
  "query": {
    "query_string": {
      "query": "warehouse OR cold*",
      "default_field": "location"
    }
  },
  "aggs": {
    "by_location": {
      "terms": {
        "field": "location"
      },
      "aggs": {
        "by_sensor": {
          "terms": {
            "field": "sensor_id"
          },
          "aggs": {
            "average temperature": {
              "avg": {
                "field": "temperature"
              }
            }
          }
        }
      }
    }
  }
}
The response contains one bucket per matching location:
{
  "took": 52,
  "timed_out": false,
  "_shards": {
    "total": 1,
    "successful": 1,
    "skipped": 0,
    "failed": 0
  },
  "hits": {
    "total": {
      "value": 3,
      "relation": "eq"
    },
    "max_score": null,
    "hits": []
  },
  "aggregations": {
    "by_location": {
      "doc_count_error_upper_bound": 0,
      "sum_other_doc_count": 0,
      "buckets": [
        {
          "key": "cold-store",
          "doc_count": 2,
          "by_sensor": {
            "doc_count_error_upper_bound": 0,
            "sum_other_doc_count": 0,
            "buckets": [
              {
                "key": "s2",
                "doc_count": 2,
                "average temperature": {
                  "value": 5.0
                }
              }
            ]
          }
        },
        {
          "key": "warehouse",
          "doc_count": 2,
          "by_sensor": {
            "doc_count_error_upper_bound": 0,
            "sum_other_doc_count": 0,
            "buckets": [
              {
                "key": "s1",
                "doc_count": 2,
                "average temperature": {
                  "value": 21.75
                }
              }
            ]
          }
        }
      ]
    }
  }
}
For more information about query string query parameters, see Query string query.
Dynamic target index
In ISM rollup, the target_index field may contain a template that is compiled at the time of each rollup indexing. For example, if you specify the target_index field as rollup_ndx-{{ctx.source_index}}, the source index log-000001 will roll up into a target index rollup_ndx-log-000001. This allows you to roll up data into multiple time-based indexes, with one rollup job created for each source index.
The source_index parameter in {{ctx.source_index}} cannot contain wildcards.
Searching multiple rollup indexes
When data is rolled up into multiple target indexes, you can run one search across all of the rollup indexes. To search multiple target indexes that have the same rollup, specify the index names as a comma-separated list or a wildcard pattern. For example, with target_index as rollup_ndx-{{ctx.source_index}} and source indexes that start with log, specify the rollup_ndx-log* pattern. Or, to search for rolled up log-000001 and log-000002 indexes, specify the rollup_ndx-log-000001,rollup_ndx-log-000002 list.
Do not search a mix of rollup and non-rollup indexes with the same query. The request returns 200, but the rollup index fails as a shard failure, so the results contain only the non-rollup data.
Example
The following example demonstrates the doc_count field, dynamic index names, and searching multiple rollup indexes with the same rollup.
Step 1: Add an index template for ISM to manage the rolling over of the indexes aliased by log:
PUT _index_template/ism_rollover
{
  "index_patterns": ["log*"],
  "template": {
   "settings": {
    "plugins.index_state_management.rollover_alias": "log"
   }
 }
}
Step 2: Set up an ISM rollover policy to roll over any index whose name starts with log* after one document is uploaded to it, and then roll up the individual backing index. The target index name is dynamically generated from the source index name by prepending the string rollup_ndx- to the source index name.
PUT _plugins/_ism/policies/rollover_policy
{
  "policy": {
    "description": "Example rollover policy.",
    "default_state": "rollover",
    "states": [
      {
        "name": "rollover",
        "actions": [
          {
            "rollover": {
              "min_doc_count": 1
            }
          }
        ],
        "transitions": [
          {
            "state_name": "rp"
          }
        ]
      },
      {
        "name": "rp",
        "actions": [
          {
            "rollup": {
              "ism_rollup": {
                "target_index": "rollup_ndx-{{ctx.source_index}}",
                "description": "Example rollup job",
                "page_size": 200,
                "dimensions": [
                  {
                    "date_histogram": {
                      "source_field": "ts",
                      "fixed_interval": "60m",
                      "timezone": "America/Los_Angeles"
                    }
                  },
                  {
                    "terms": {
                      "source_field": "message.keyword"
                    }
                  }
                ],
                "metrics": [
                  {
                    "source_field": "msg_size",
                    "metrics": [
                      {
                        "sum": {}
                      }
                    ]
                  }
                ]
              }
            }
          }
        ],
        "transitions": []
      }
    ],
    "ism_template": {
      "index_patterns": ["log*"],
      "priority": 100
    }
  }
}
Step 3: Create an index named log-000001 and set up an alias log for it.
PUT log-000001
{
  "aliases": {
    "log": {
      "is_write_index": true
    }
  }
}
Step 4: Index four documents into the index created previously. Two of the documents have the message “Success”, and two have the message “Error”.
POST log/_doc?refresh=true
{
  "ts" : "2022-08-26T09:28:48-04:00",
  "message": "Success",
  "msg_size": 10
}
POST log/_doc?refresh=true
{
  "ts" : "2022-08-26T10:06:25-04:00",
  "message": "Error",
  "msg_size": 20
}
POST log/_doc?refresh=true
{
  "ts" : "2022-08-26T10:23:54-04:00",
  "message": "Error",
  "msg_size": 30
}
POST log/_doc?refresh=true
{
  "ts" : "2022-08-26T10:53:41-04:00",
  "message": "Success",
  "msg_size": 40
}
After you index the first document, the rollover action runs and creates the index log-000002 with rollover_policy attached to it. The rollup action then runs and creates the rollup index rollup_ndx-log-000001.
Each step waits for the next run of the ISM job, so the full sequence takes several ISM cycles to complete—about 20 minutes at the default job_interval of 5 minutes. To follow its progress, run GET _plugins/_ism/explain and watch the state change.
Step 5: Search the rollup index.
GET rollup_ndx-log-*/_search
{
  "size": 0,
  "query": {
    "match_all": {}
  },
  "aggregations": {
    "message_numbers": {
      "terms": {
        "field": "message.keyword"
      },
      "aggs": {
        "per_message": {
          "terms": {
            "field": "message.keyword"
          },
          "aggregations": {
            "sum_message": {
              "sum": {
                "field": "msg_size"
              }
            }
          }
        }
      }
    }
  }
}
The response contains two buckets, “Error” and “Success”, and the document count for each bucket is 2:
{
  "took" : 30,
  "timed_out" : false,
  "_shards" : {
    "total" : 1,
    "successful" : 1,
    "skipped" : 0,
    "failed" : 0
  },
  "hits" : {
    "total" : {
      "value" : 4,
      "relation" : "eq"
    },
    "max_score" : null,
    "hits" : [ ]
  },
  "aggregations" : {
    "message_numbers" : {
      "doc_count_error_upper_bound" : 0,
      "sum_other_doc_count" : 0,
      "buckets" : [
        {
          "key" : "Success",
          "doc_count" : 2,
          "per_message" : {
            "doc_count_error_upper_bound" : 0,
            "sum_other_doc_count" : 0,
            "buckets" : [
              {
                "key" : "Success",
                "doc_count" : 2,
                "sum_message" : {
                  "value" : 50.0
                }
              }
            ]
          }
        },
        {
          "key" : "Error",
          "doc_count" : 2,
          "per_message" : {
            "doc_count_error_upper_bound" : 0,
            "sum_other_doc_count" : 0,
            "buckets" : [
              {
                "key" : "Error",
                "doc_count" : 2,
                "sum_message" : {
                  "value" : 50.0
                }
              }
            ]
          }
        }
      ]
    }
  }
}
Index codec considerations
For index codec considerations, see Index codecs.
Index rollups in OpenSearch Dashboards
To navigate to the Index Management page, go to Management > Index Management on the top menu. Select Rollup jobs to list the rollup jobs in your cluster with their status and the time of their next run. Select a job to view its configuration and the results of its runs. To act on a job, select the checkbox next to it and then select Enable, Disable, or Actions > Delete.
The following image shows the Rollup jobs page.
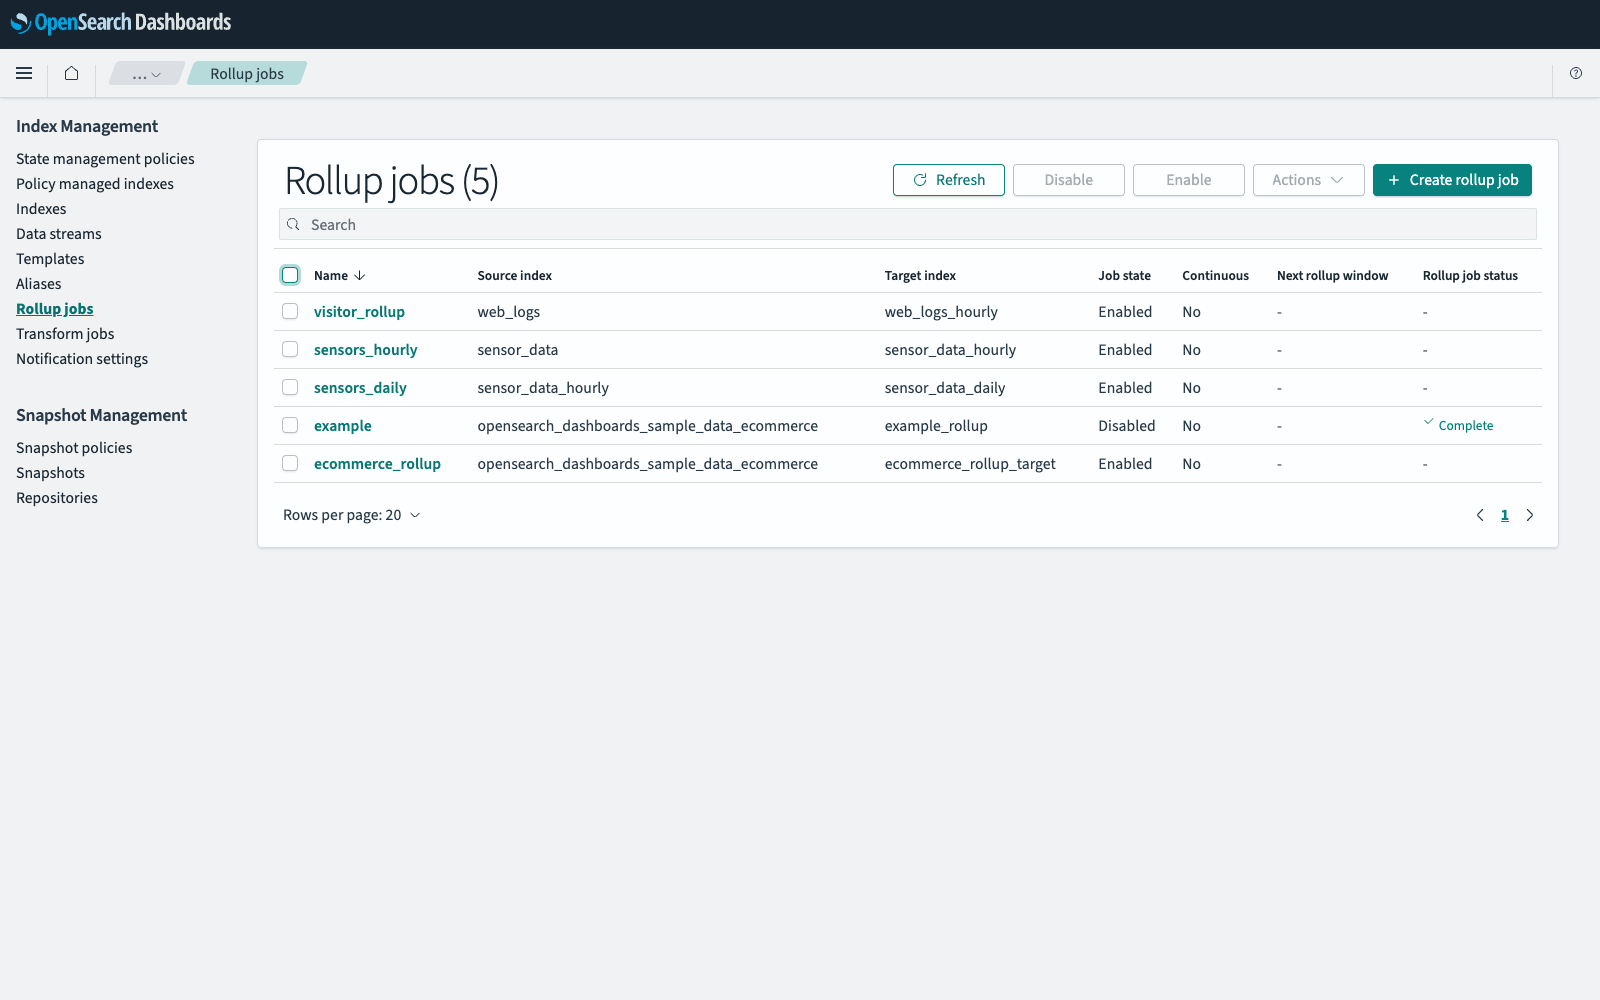
A rollup job needs a source index that contains a timestamp field. If your cluster has no time-series data to roll up, add the sample e-commerce data from the OpenSearch Dashboards home page and roll up its order_date field, as described in Sample walkthrough.
Creating a rollup job
- In Index Management, select Rollup jobs, and then select Create rollup job.
- Enter a Name for the job and, optionally, a description.
- In Source index, select the index or index pattern to roll up.
- In Target index, select an existing index or enter a name for a new one. The name can contain embedded variables.
- Select Next.
-
In Time aggregation, do the following:
- Select the Timestamp field to aggregate on.
- Select an Interval type. Fixed intervals are all the same length. Calendar intervals follow calendar entities, such as months, and can be unequal.
- In Interval, select the length of the interval.
- In Timezone, select the time zone of the timestamp.
-
Optionally, in Additional aggregation, add the fields to group by:
- Select Add fields, select the field names, and then select Add.
- For each field, select an Aggregation method. Keyword fields can only be aggregated by term.
- For each histogram aggregation, enter the number of timestamp intervals per bucket in Interval.
- Optionally, reorder the fields so that the fields with the fewest buckets come first.
-
Optionally, in Additional metrics, add the metrics to save:
- Select Add fields, select the numeric field names, and then select Add.
- For each field, select the metrics to save: Min, Max, Sum, Avg, Value count, or All. To save every metric for every field in the table, select Enable all; to clear them, select Disable all.
- Select Next.
-
In Schedule, do the following:
- To run the job on its schedule rather than only when a policy calls it, keep Enable job by default selected.
- To roll up data as it is ingested, select Yes in Continuous.
- In Rollup execution frequency, select Define by fixed interval and enter the Rollup interval, or select Define by cron expression and enter a cron expression and a time zone. For the expression syntax, see Cron expressions.
- In Page per execution, enter the number of pages to process in each run. A larger number runs faster and uses more memory.
- Optionally, in Execution delay, enter how long the job waits for ingestion to finish before it runs.
- Select Next, review the configuration, and then select Create.