You're viewing version 3.8 of the OpenSearch documentation. This version is no longer maintained. For the latest version, see the current documentation. For information about OpenSearch version maintenance, see Release Schedule and Maintenance Policy.
Managing dashboard variables
You can create, edit, delete, organize, and view dashboard variables from within a dashboard.
Prerequisites
Before you start, ensure that you have met the following prerequisites:
- Dashboard variables are enabled in your
opensearch_dashboards.ymlfile. - You have an Observability workspace set up.
For the complete setup, see Creating and using dashboard variables.
Creating a query variable
Use a query variable when the list of available values is retrieved from a data source. For example, you can create an extension variable from the sample web logs data and use it to filter multiple visualizations by file extension.
The following example uses the OpenSearch Dashboards sample web logs data. If you use a different dataset, select the dataset and fields that match your data.
To create a query variable, follow these steps:
- In your Observability workspace, select Dashboards in the left navigation.
- Open an existing dashboard or select Create > Dashboard to create a new dashboard. If you create a new dashboard, save it first by entering a title and selecting Save.
- At the top of the dashboard, select Add variable.
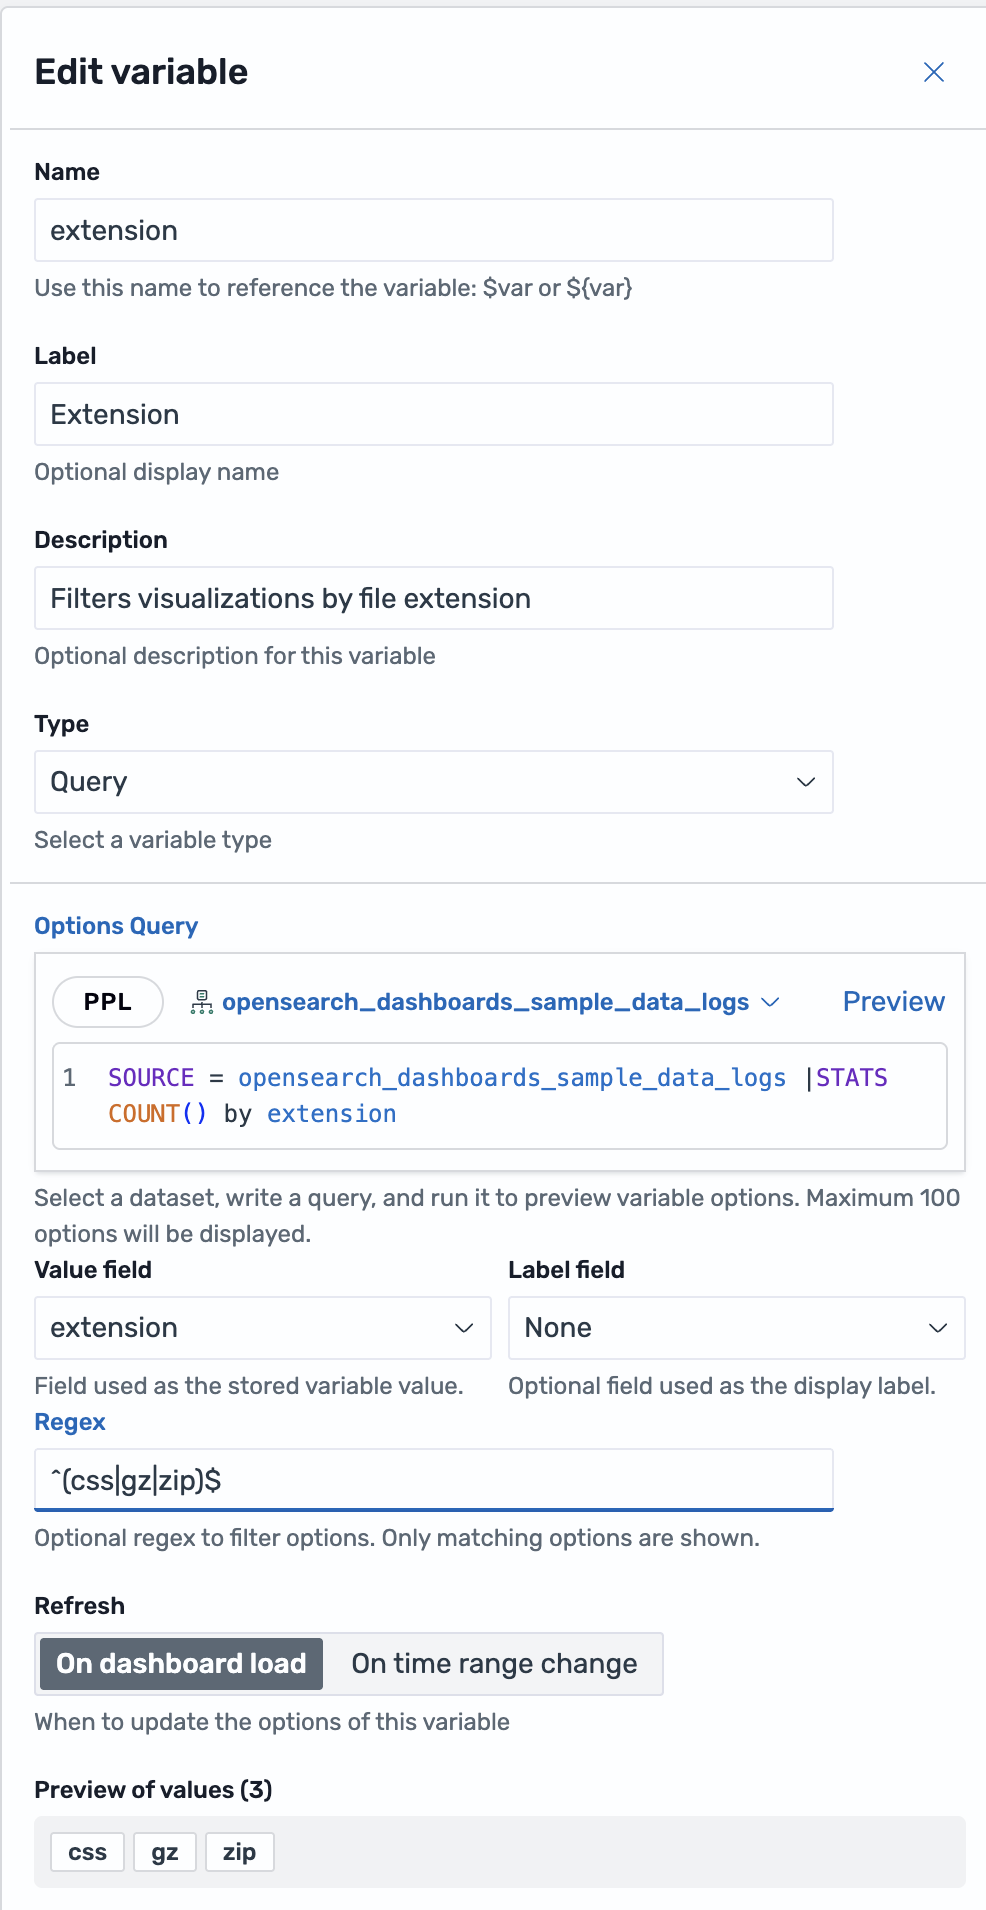
- Configure the following general settings:
- Name: Enter
extension. This is the identifier used to reference the variable in queries, for example,$extensionor${extension}. - Label: Enter
Extension. This is the display name shown at the top of the dashboard. - Description: Optionally, enter a description, such as
Filters visualizations by file extension. - Type: Select Query.
- Name: Enter
- In Options Query, keep the language set to PPL.
- In the dataset selector, select
opensearch_dashboards_sample_data_logs. -
Enter the following query:
source = opensearch_dashboards_sample_data_logs | stats count() by extension | fields extension - Select Preview. The preview runs the query, loads the fields returned by the query, and displays the first 100 variable options. You must successfully preview a query variable before you can save it.
- In Value field, select
extension. The value field provides the value inserted into queries when you use$extensionor${extension}. - In Label field, keep None. Select a label field only when the query returns a separate field to display in the dropdown list in place of the stored value.
- Optional: In Regex, enter a regular expression to filter the available options by value. For example,
^(css|gz|zip)$displays only thecss,gz, andzipoptions. - In Refresh, choose when OpenSearch Dashboards updates the variable options:
- On dashboard load: Refreshes options when the dashboard loads.
- On time range change: Refreshes options when the dashboard time range changes. Use this option when the available values depend on the selected time range.
- Configure the shared option settings. For more information, see Configuring variable option settings.
- Select Add variable.
The variable appears at the top of the dashboard. The following image shows an extension query variable configured using the sample web logs data.
Mapping query result fields
A query variable can use one field as the stored value and another field as the display label:
- Value field: The field used as the variable value. OpenSearch Dashboards inserts this value into queries when you reference the variable.
- Label field: An optional field used as the display label in the variable dropdown list. The label does not change the value inserted into queries.
For example, if your query returns service_id and service_name, set Value field to service_id and Label field to service_name. The dropdown list displays the service name, and queries receive the service ID.
If you do not select a value field, OpenSearch Dashboards uses the first field returned by the query. To avoid unexpected values, preview the query and explicitly select the field to use as the variable value.
Creating a custom variable
Use a custom variable when the list of available values is fixed and does not need to be fetched from a data source. For example, you can create an environment variable containing the dev, staging, and prod options.
To create a custom variable, follow these steps:
- In your Observability workspace, select Dashboards in the left navigation.
- Open an existing dashboard or select Create > Dashboard to create a new dashboard. If you create a new dashboard, save it first by entering a title and selecting Save.
- At the top of the dashboard, select Add variable.
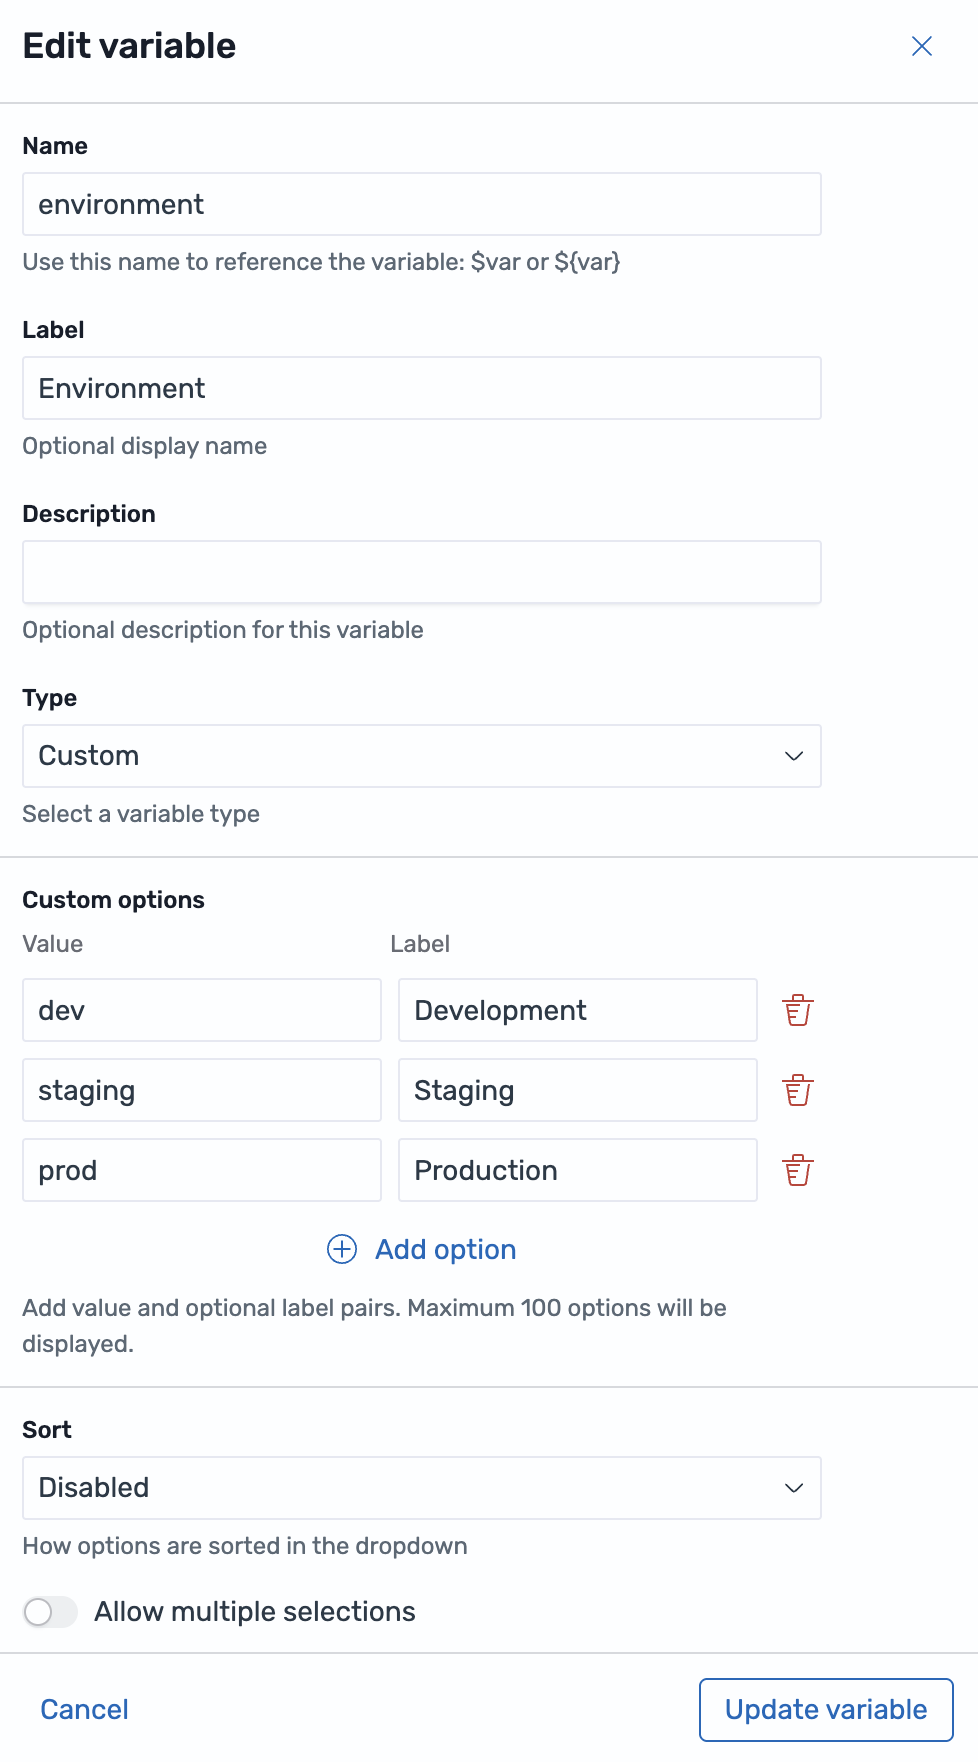
- Configure the following general settings:
- Name: Enter
environment. This is the identifier used to reference the variable in queries, for example,$environmentor${environment}. - Label: Enter
Environment. - Description: Optionally, enter a description, such as
Filters visualizations by deployment environment. - Type: Select Custom.
- Name: Enter
- In Custom options, select Add option.
- In the first option row, enter
devin Value andDevelopmentin Label. OpenSearch Dashboards inserts the value into queries when you reference the variable and uses the optional label as the display text in the dropdown list. - Select Add option again and enter
stagingin Value andStagingin Label. - Select Add option again and enter
prodin Value andProductionin Label. - Configure the shared option settings. For more information, see Configuring variable option settings.
- Select Add variable.
Custom option values must be unique and cannot be empty. OpenSearch Dashboards displays a maximum of 100 options in the dropdown list.
The following image shows an environment custom variable configured with value and label pairs.
Configuring variable option settings
Query variables and custom variables share the following option settings:
- Sort: Controls how options are sorted in the dropdown list. Select Disabled, Alphabetical ascending or descending, or Numerical ascending or descending.
- Allow multiple selections: Allows you to select more than one value from the variable dropdown list.
- Include All option: Adds an All option to the dropdown list. This setting is available only when Allow multiple selections is turned on.
Managing existing variables
The Manage variables panel lists all existing variables, including their type, name, and configuration options. To access this panel, follow these steps:
- Navigate to your workspace.
- From Dashboards, select the dashboard to update.
- On the top, toggle the Edit selector to enter edit mode.
- In the upper-left corner, select the Manage variables icon, as shown in the following image.
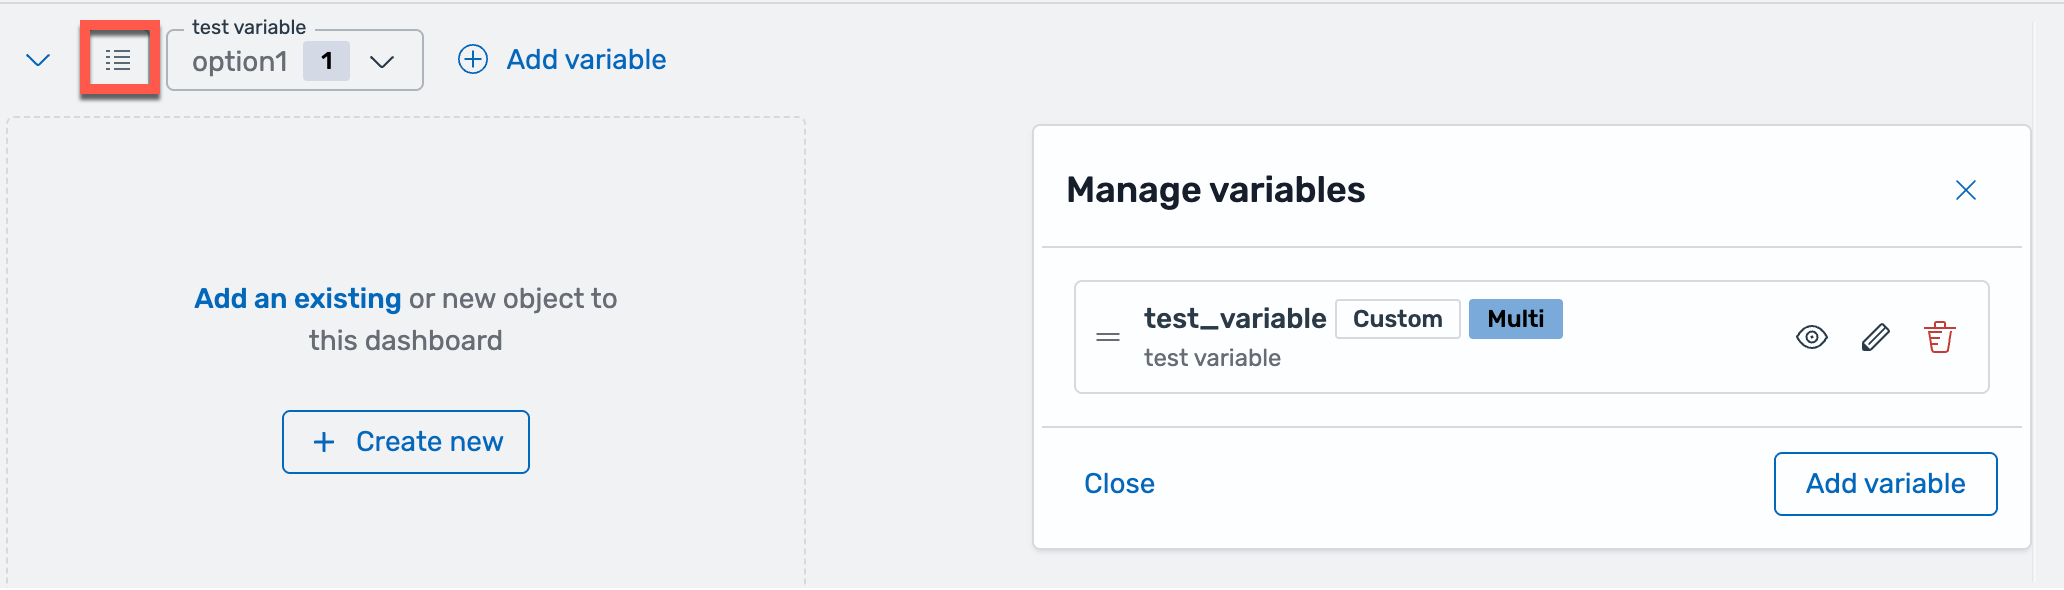
The Manage variables icon only appears when variables have been created in the dashboard. If no variables exist, create one first before accessing the management interface.
Editing a variable
To edit an existing variable, follow these steps:
- Open the Manage variables panel.
- Select the Edit icon for the variable you want to modify.
- Make your changes.
- Select Update variable to save.
Changing the variable name causes any queries that reference the old name to fail.
Deleting a variable
To delete a variable, follow these steps:
- Open the Manage variables panel.
- Select the Delete icon for the variable you want to remove.
- Confirm the deletion in the dialog.
Variables that are referenced by other variables or visualization editors display an indicator in the management panel. Deleting a referenced variable causes any queries that use it to fail.
Organizing variables
Variables are displayed at the top of the dashboard in the order they appear in the management panel.
To reorder variables, follow these steps:
- Open the Manage variables panel.
- Drag the reorder handle on the left side of a variable.
- Drop it in the desired position.
- Save the dashboard to apply the new order.
Hiding variables
You can hide variables from the top of the dashboard while keeping them available for use in queries.
To hide or show a variable, follow these steps:
- Open the Manage variables panel.
- Select the Hide/Show icon for the variable.
- Save the dashboard to apply the change.
Hidden variables are marked with a Hidden badge in the management panel and do not appear in the dashboard.
Variable status indicators
Each variable displays a status indicator at the top of the dashboard:
- Loading: A spinner appears while the system fetches options.
- Error: An error icon appears with a tooltip showing the error message. The dropdown is disabled.
- No options: If a variable query returns no results, “No options” is displayed in the dropdown.
URL synchronization
Variable values are automatically synchronized to the dashboard URL using the variableValues query parameter:
?variableValues=(service:(api),region:(us-east,us-west))
URL synchronization enables the following functionality:
- Send a link to a dashboard with specific variable values preselected.
- Save a dashboard view with your preferred variable settings.
- Preserve variable selections across page refreshes.
Variable dependencies
Query type variables can reference other variables in their queries. The following example shows a query variable that references another variable:
source=logs | where region=$region | dedup service | fields service
In this example, the service variable depends on the region variable. When the region variable changes, the service variable automatically refreshes its options.
Keep the following considerations in mind:
- Avoid circular dependencies where Variable A references Variable B, and Variable B references Variable A.
- Variables are evaluated in the order they appear in the management panel. Place dependent variables after the variables they reference.