Query insights dashboards
You can interact with the query insights feature in OpenSearch Dashboards. This gives you real-time and historical insights into query performance, providing analytics and monitoring to improve how queries are run in your cluster.
Navigation
After logging in to OpenSearch Dashboards, you can find the Query insights page by navigating to OpenSearch Plugins > Query insights.
If you have multiple data sources enabled, the Query insights page can be found by navigating to Data administration > Performance > Query insights.
The Query insights dashboard contains the following pages:
- Top N queries: Displays the query metrics and details for the top queries.
- Query details: Displays details for individual queries and query groups.
- Configuration: Customizes all monitoring and data retention settings for the query insights feature.
- Live queries: Monitors currently running queries in real time.
Top N queries
The Top N queries page provides a detailed overview of the queries that have the highest impact on system resources or performance. There, you can analyze query metrics such as latency, CPU time, and memory usage.
The following image of the Top N queries page contains letter labels for each component.
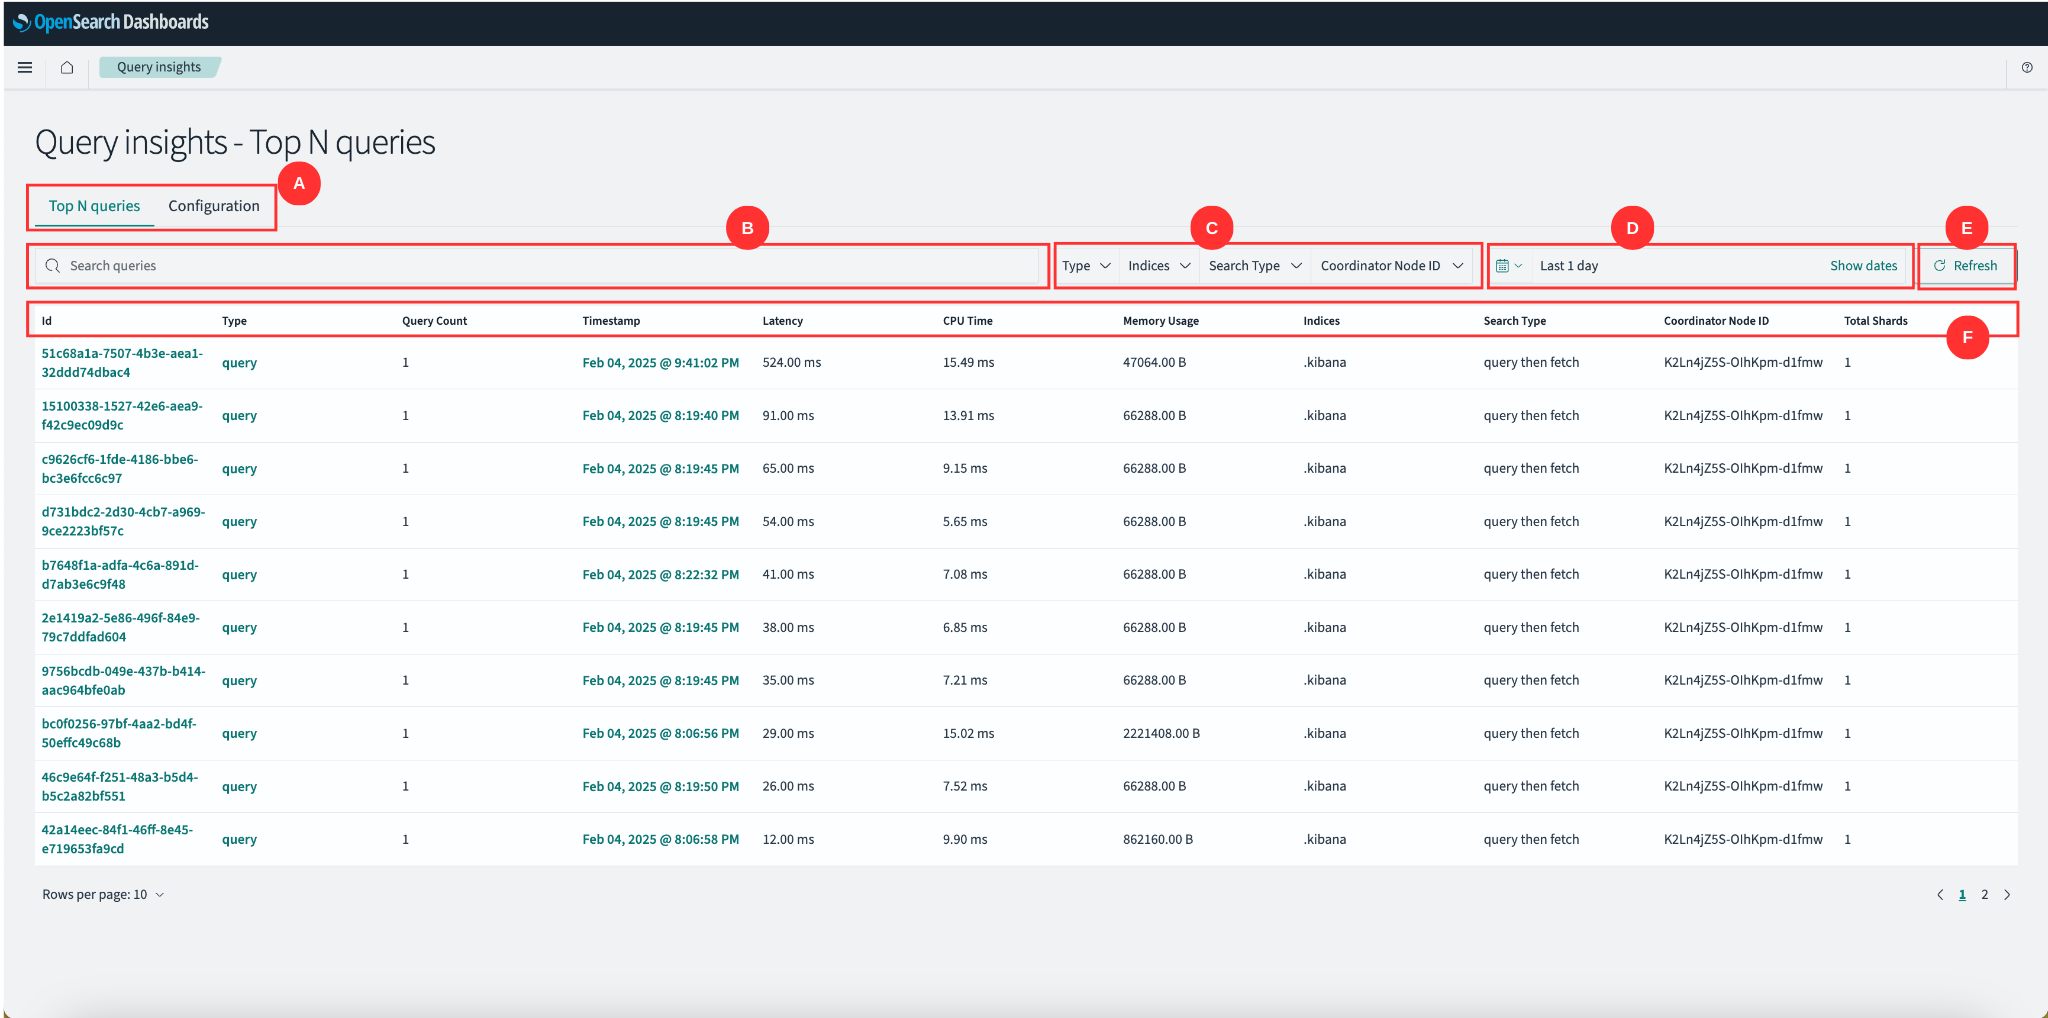
Each label corresponds to the following components:
- A. Navigation tabs
- B. Search queries bar
- C. Filters
- D. Date range selector
- E. Refresh button
- F. Metrics table
A. Navigation tabs
The navigation tabs allow you to switch between the Live Queries, Top N Queries, and Configuration pages.
B. Search queries bar
The search queries bar filters queries based on specific attributes such as query type or indexes. You can use additional filters as shown in the Filters section.
C. Filters
The filters dropdown menus allow you to select the following query filters.
| Filter | Description | Example |
|---|---|---|
| Type | Filter by query type. | query, group |
| Indexes | Filter queries based on specific OpenSearch indexes. | index1, index2 |
| Search Type | Filter by search execution method. | query then fetch |
| Coordinator Node ID | Focus on queries executed by a specific coordinator node. | node-1, node-2 |
| Time Range | Adjust the time range for the queries displayed. | last 1 day |
D. Date range selector
The data range selector analyzes queries sent during a set time frame. You can also select Show dates to provide detailed time stamps for each query.
E. Refresh button
The Refresh button reloads the query data based on the selected filters and time range.
F. Metrics table
The metrics table dynamically adapts based on your Type filter selection (Query, Group, or both). Dynamic columns improve clarity by showing only the relevant data for each query type.
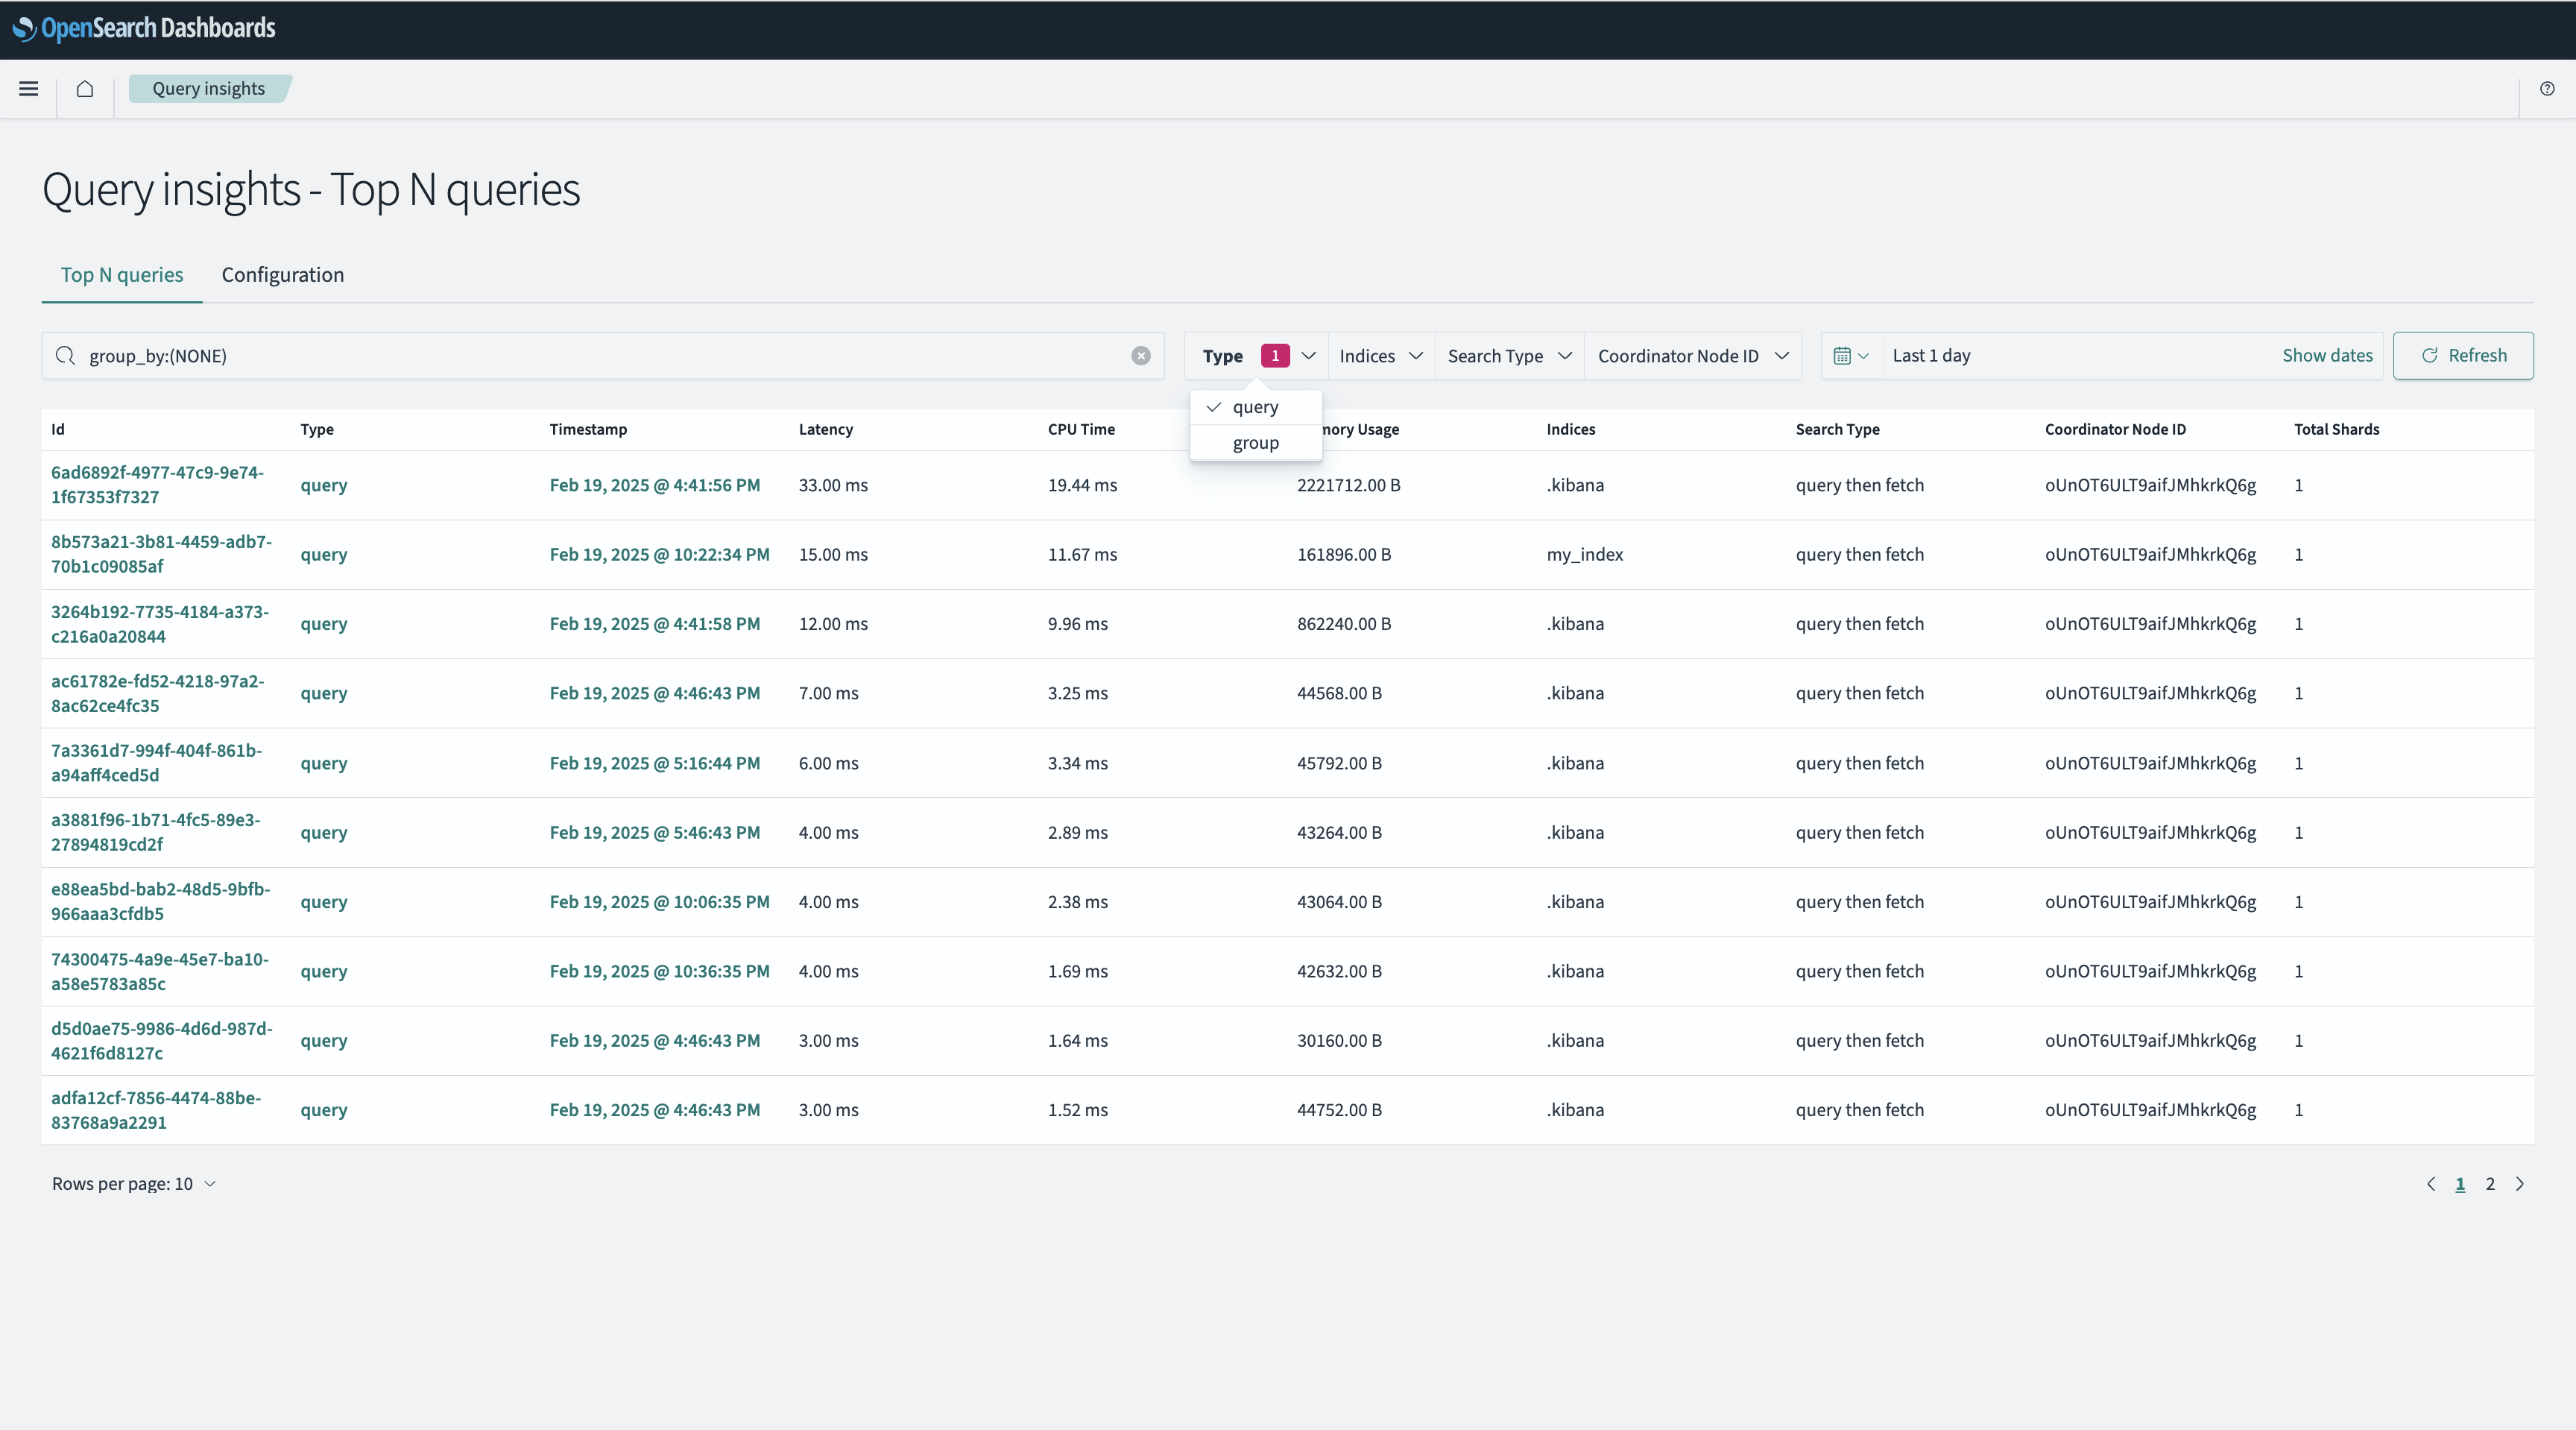
When you select queries only, the table displays individual metrics, including Latency, CPU Time, and Memory Usage. The Query Count column isn’t displayed because each row represents a single query, as shown in the following image.
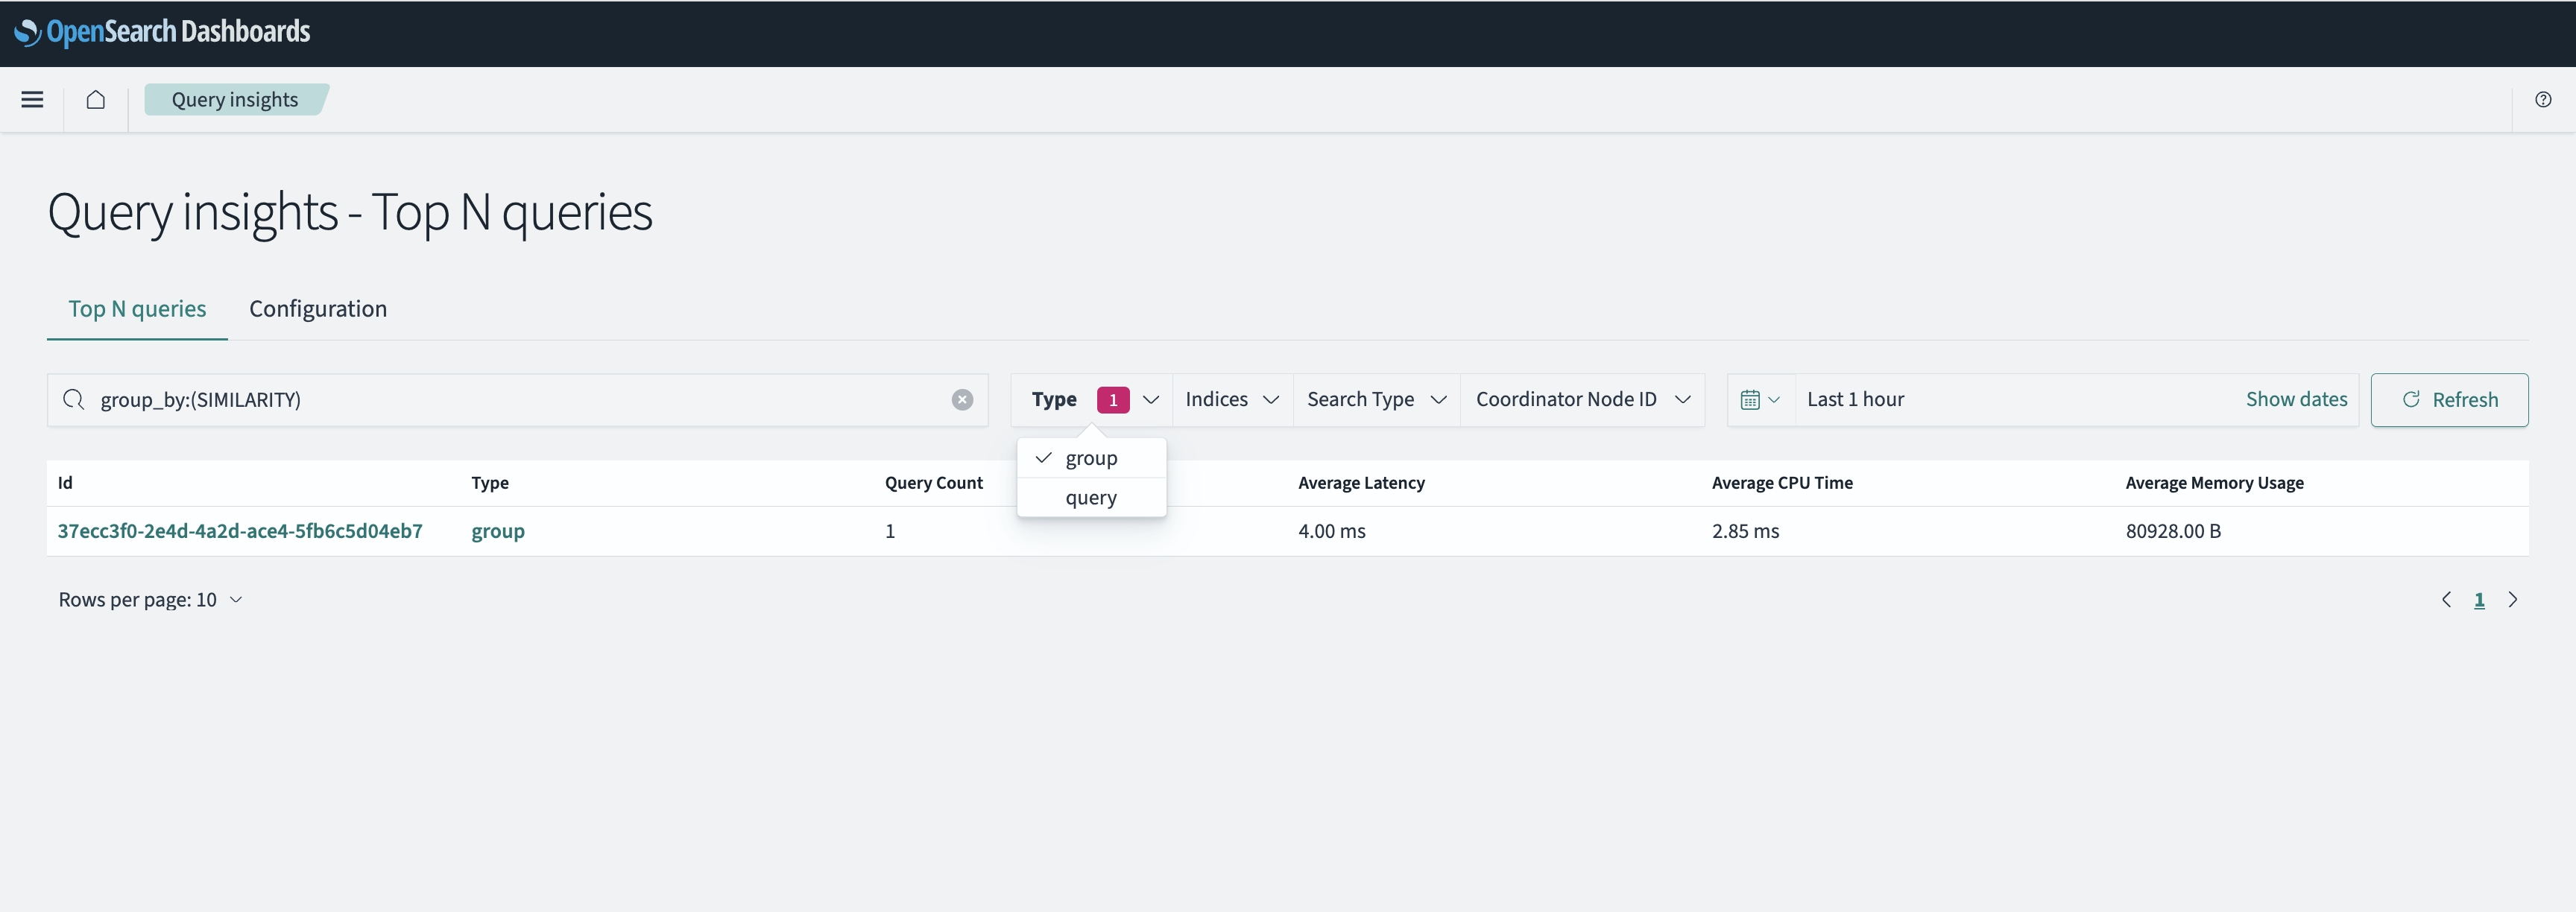
When you select groups only, the table displays aggregated metrics, including Average Latency, Average CPU Time, and Average Memory Usage. The Query Count column shows how many queries are in each group, as shown in the following image.
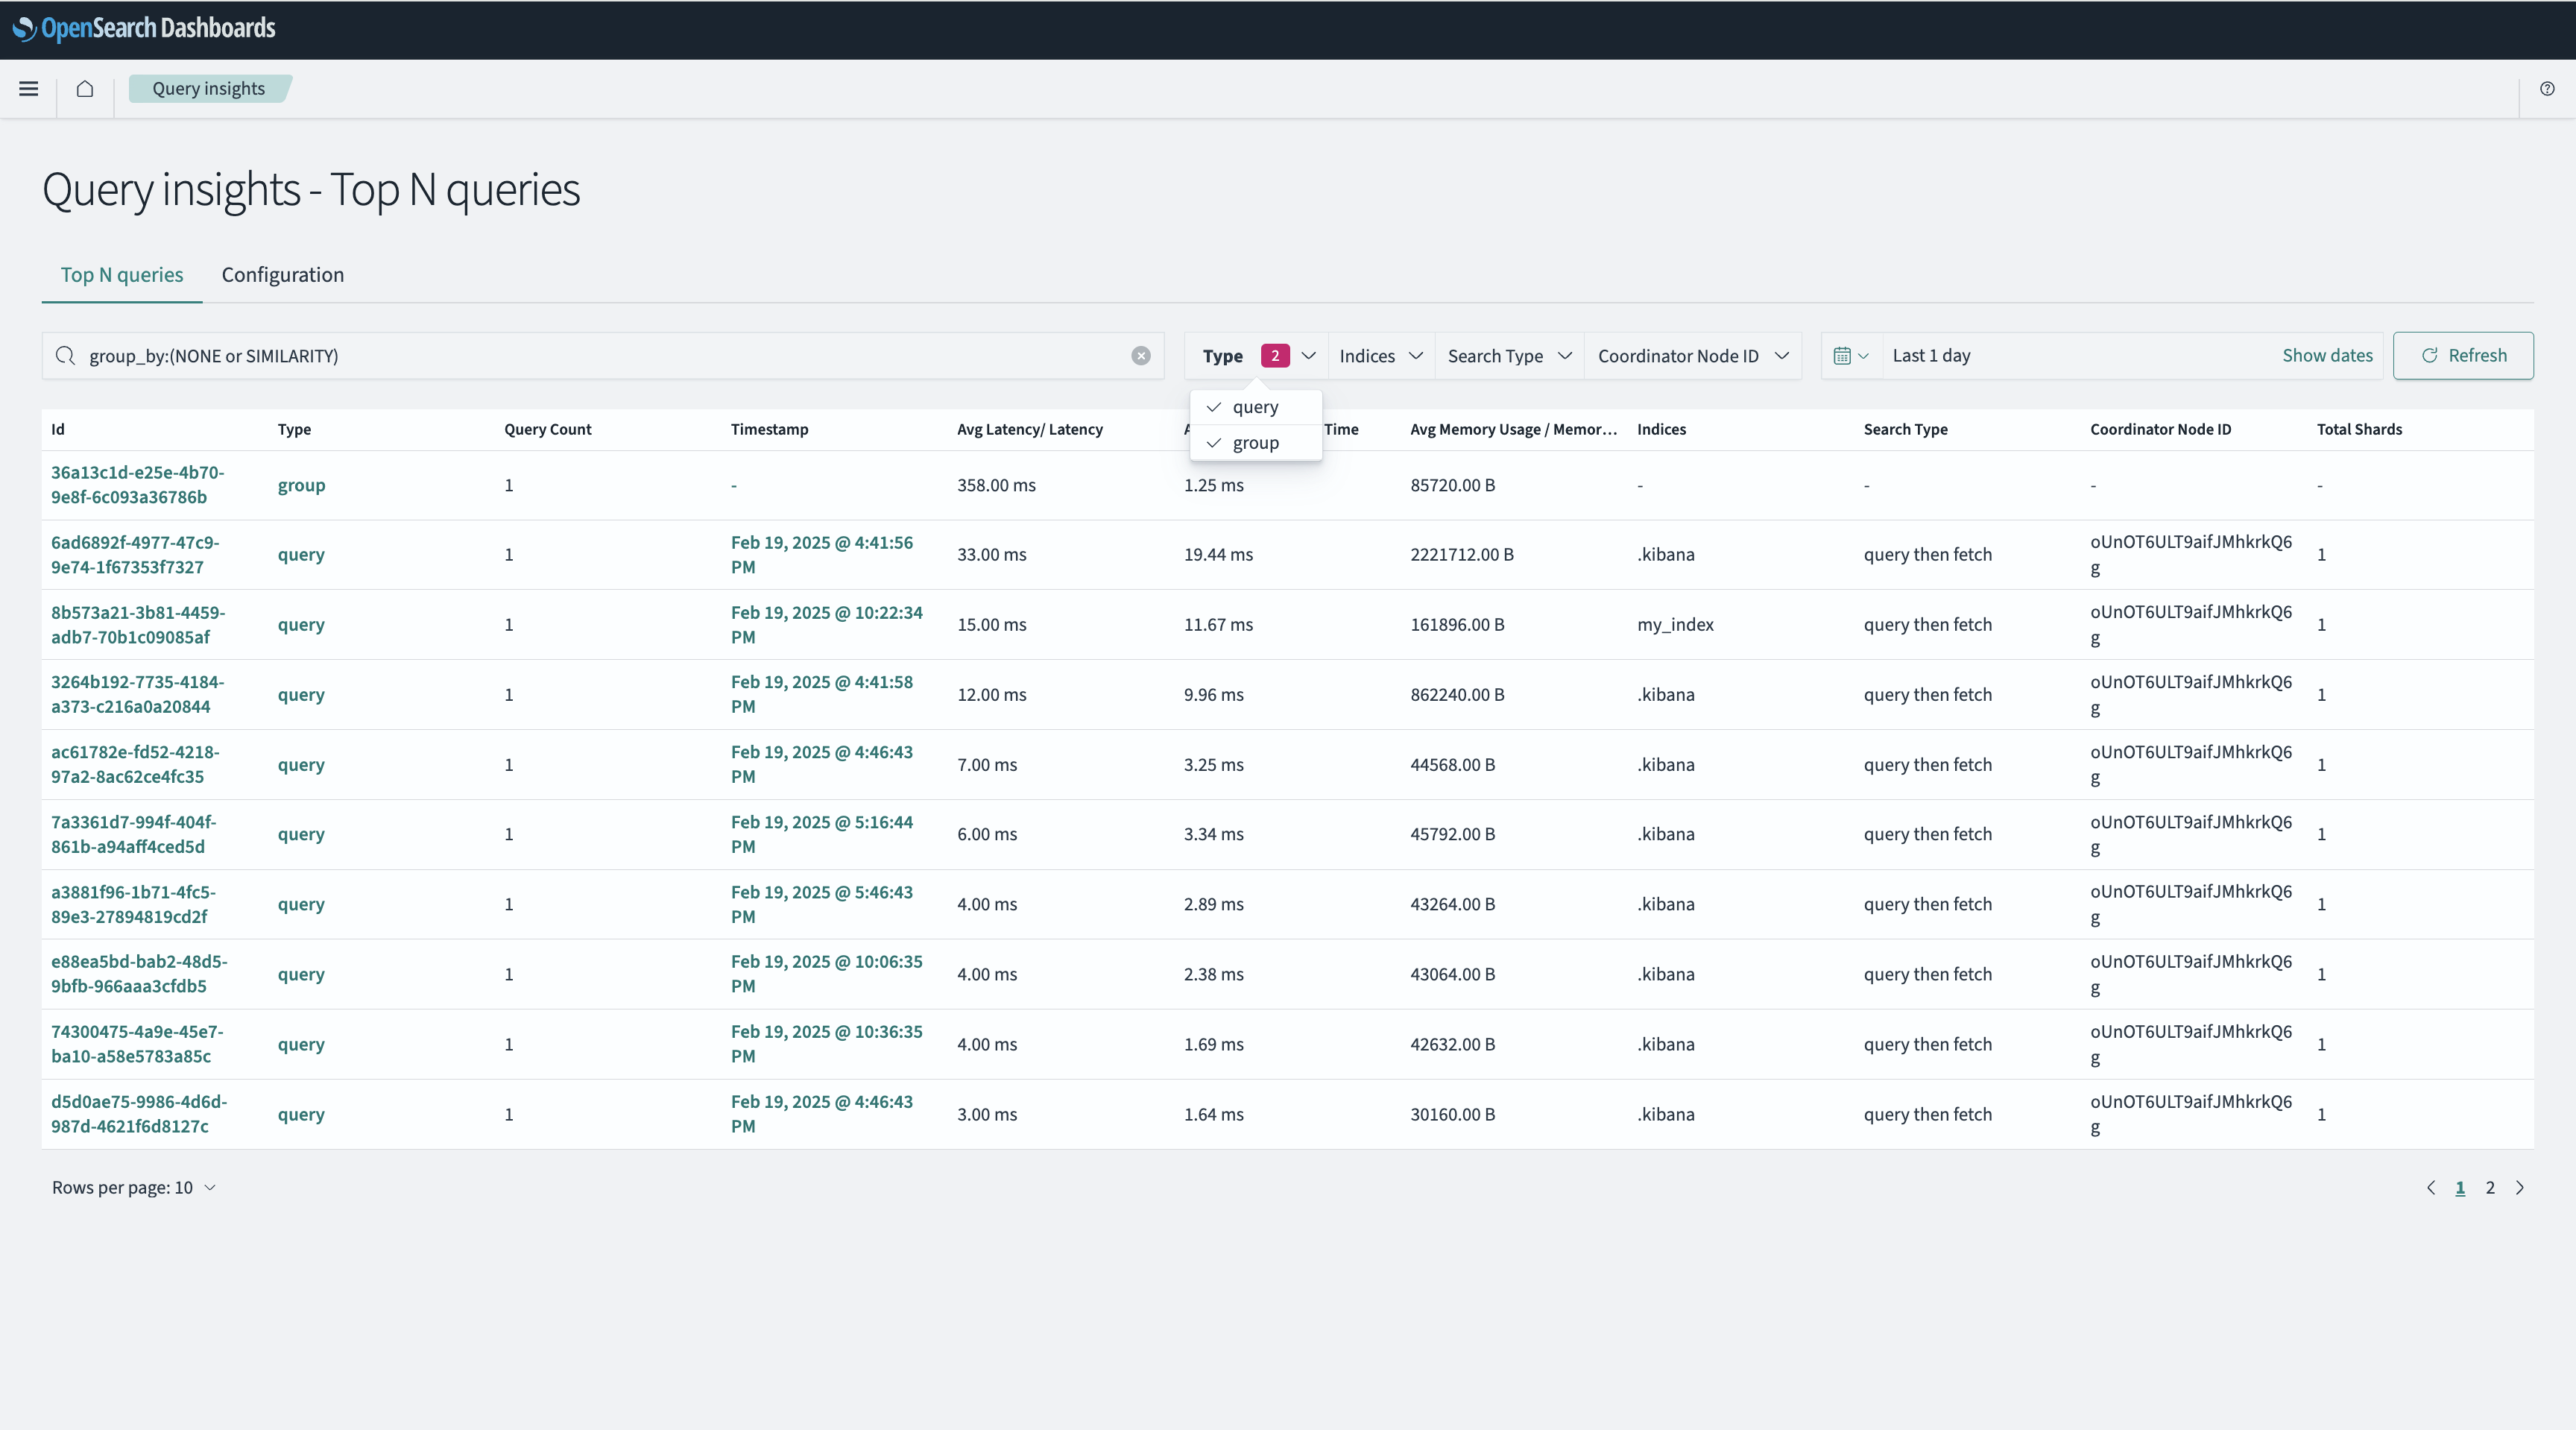
When you select both groups and queries, the table displays combined metrics, including both averaged and raw values, as shown in the following image.
The following table provides descriptions for each metric and the metric’s related query and group when selected.
| Column name | Description | Query selected | Group selected | Query + group selected |
|---|---|---|---|---|
| ID | The unique identifier for the query or group. | ID | ID | ID |
| Type | Indicates whether the entry is a query or a group. | Type | Type | Type |
| Query Count | The number of queries aggregated in the group. | Not shown | Query Count | Query Count |
| Timestamp | The time at which the query or group was recorded (may be empty for groups). | Timestamp | Not shown | Timestamp |
| Latency | The amount of time taken for individual queries to execute. | Latency | Average Latency | Avg Latency/Latency |
| CPU Time | The number of CPU resources consumed. | CPU Time | Average CPU Time | Avg CPU Time/CPU Time |
| Memory Usage | The amount of memory used during execution. | Memory Usage | Average Memory Usage | Avg Memory Usage/Memory Usage |
| Indexes | A list of indexes involved in the query or group. | Indexes | Not shown | Indexes |
| Search Type | The search execution method used (such as query or fetch). | Search Type | Not shown | Search Type |
| Coordinator Node ID | The node that coordinated the query. | Coordinator Node ID | Not shown | Coordinator Node ID |
| Total Shards | The number of shards involved in query processing. | Total Shards | Not shown | Total Shards |
When you select Query + Group:
- If all displayed rows are queries, then the table follows the Query Selected behavior.
- If all displayed rows are groups, then the table follows the Group Selected behavior.
Query details
The Query details page provides insights into query behavior, performance, and structure. You can access the query details page by selecting the query ID, as shown in the following image:
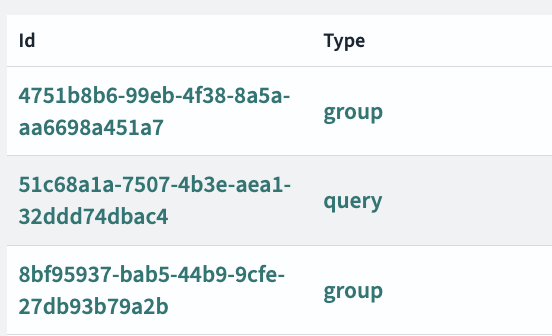
Viewing individual query details
You can access detailed information about a single query by selecting the query ID, such as 51c68a1a-7507-4b3e-aea1-32ddd74dbac4. The query details page will appear, as shown in the following image.
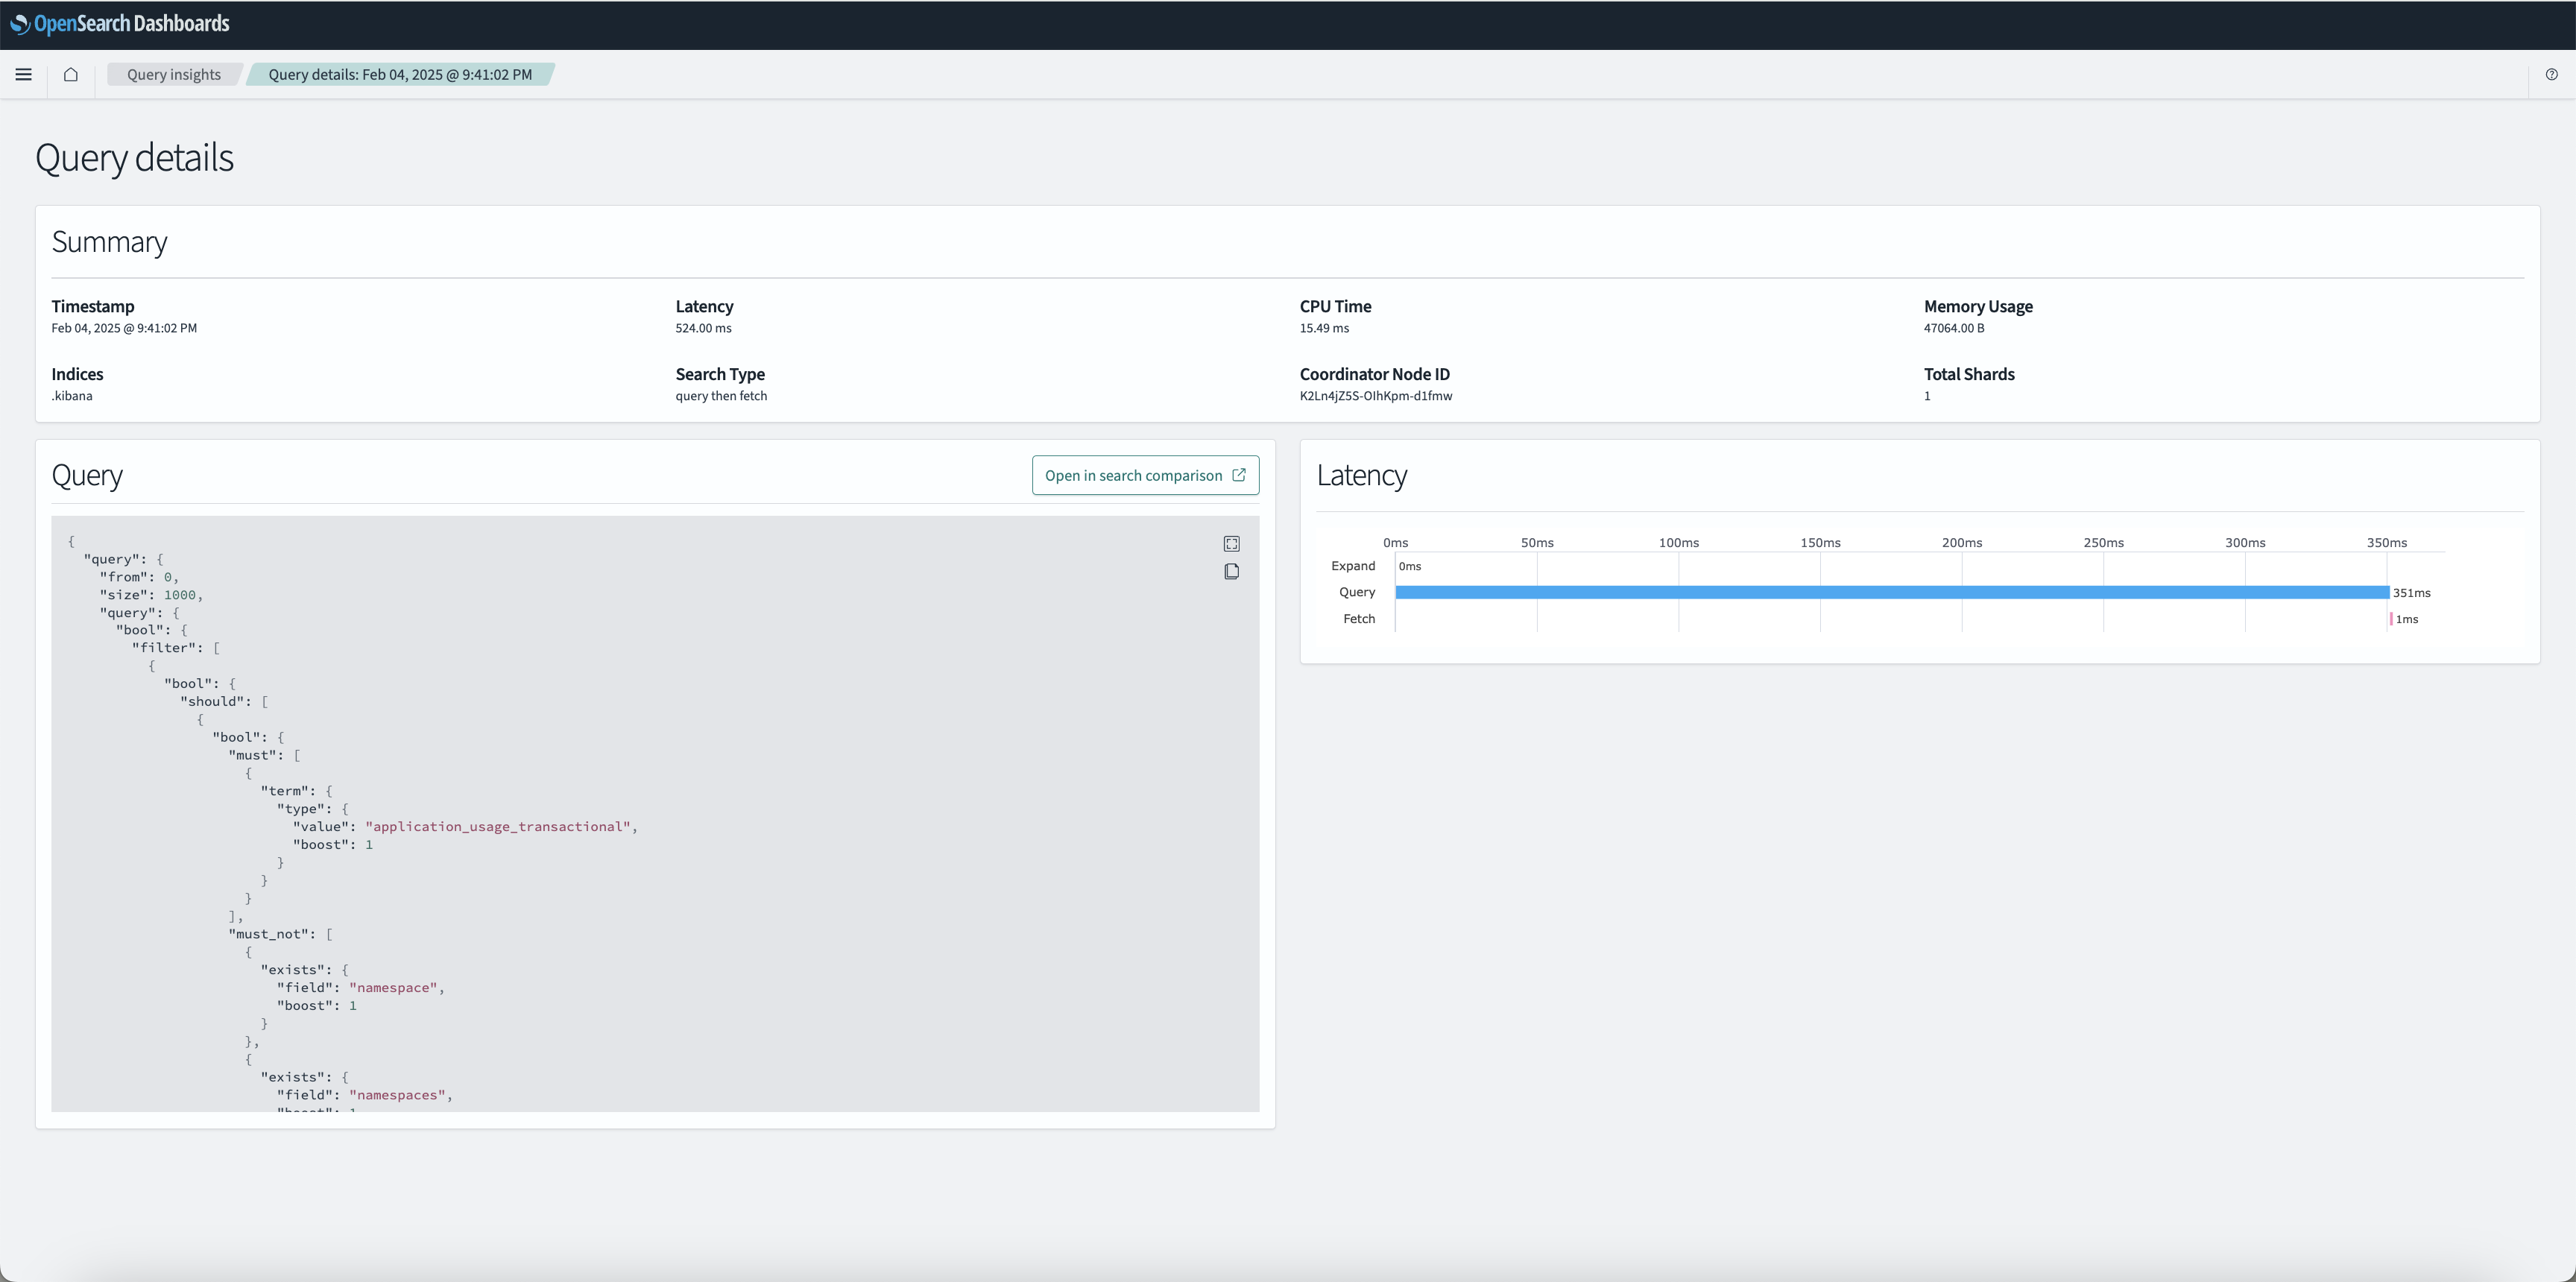
In the query details view, you can view information such as Timestamp, CPU Time, Memory Usage, Indexes, Search Type, Coordinator Node ID, and Total Shards.
Viewing query group details
The query group details view provides insights into aggregated metrics for a group of similar queries.
To view query group details, select a query ID marked as a “group” in the Top N queries list. The query group details view provides the following information:
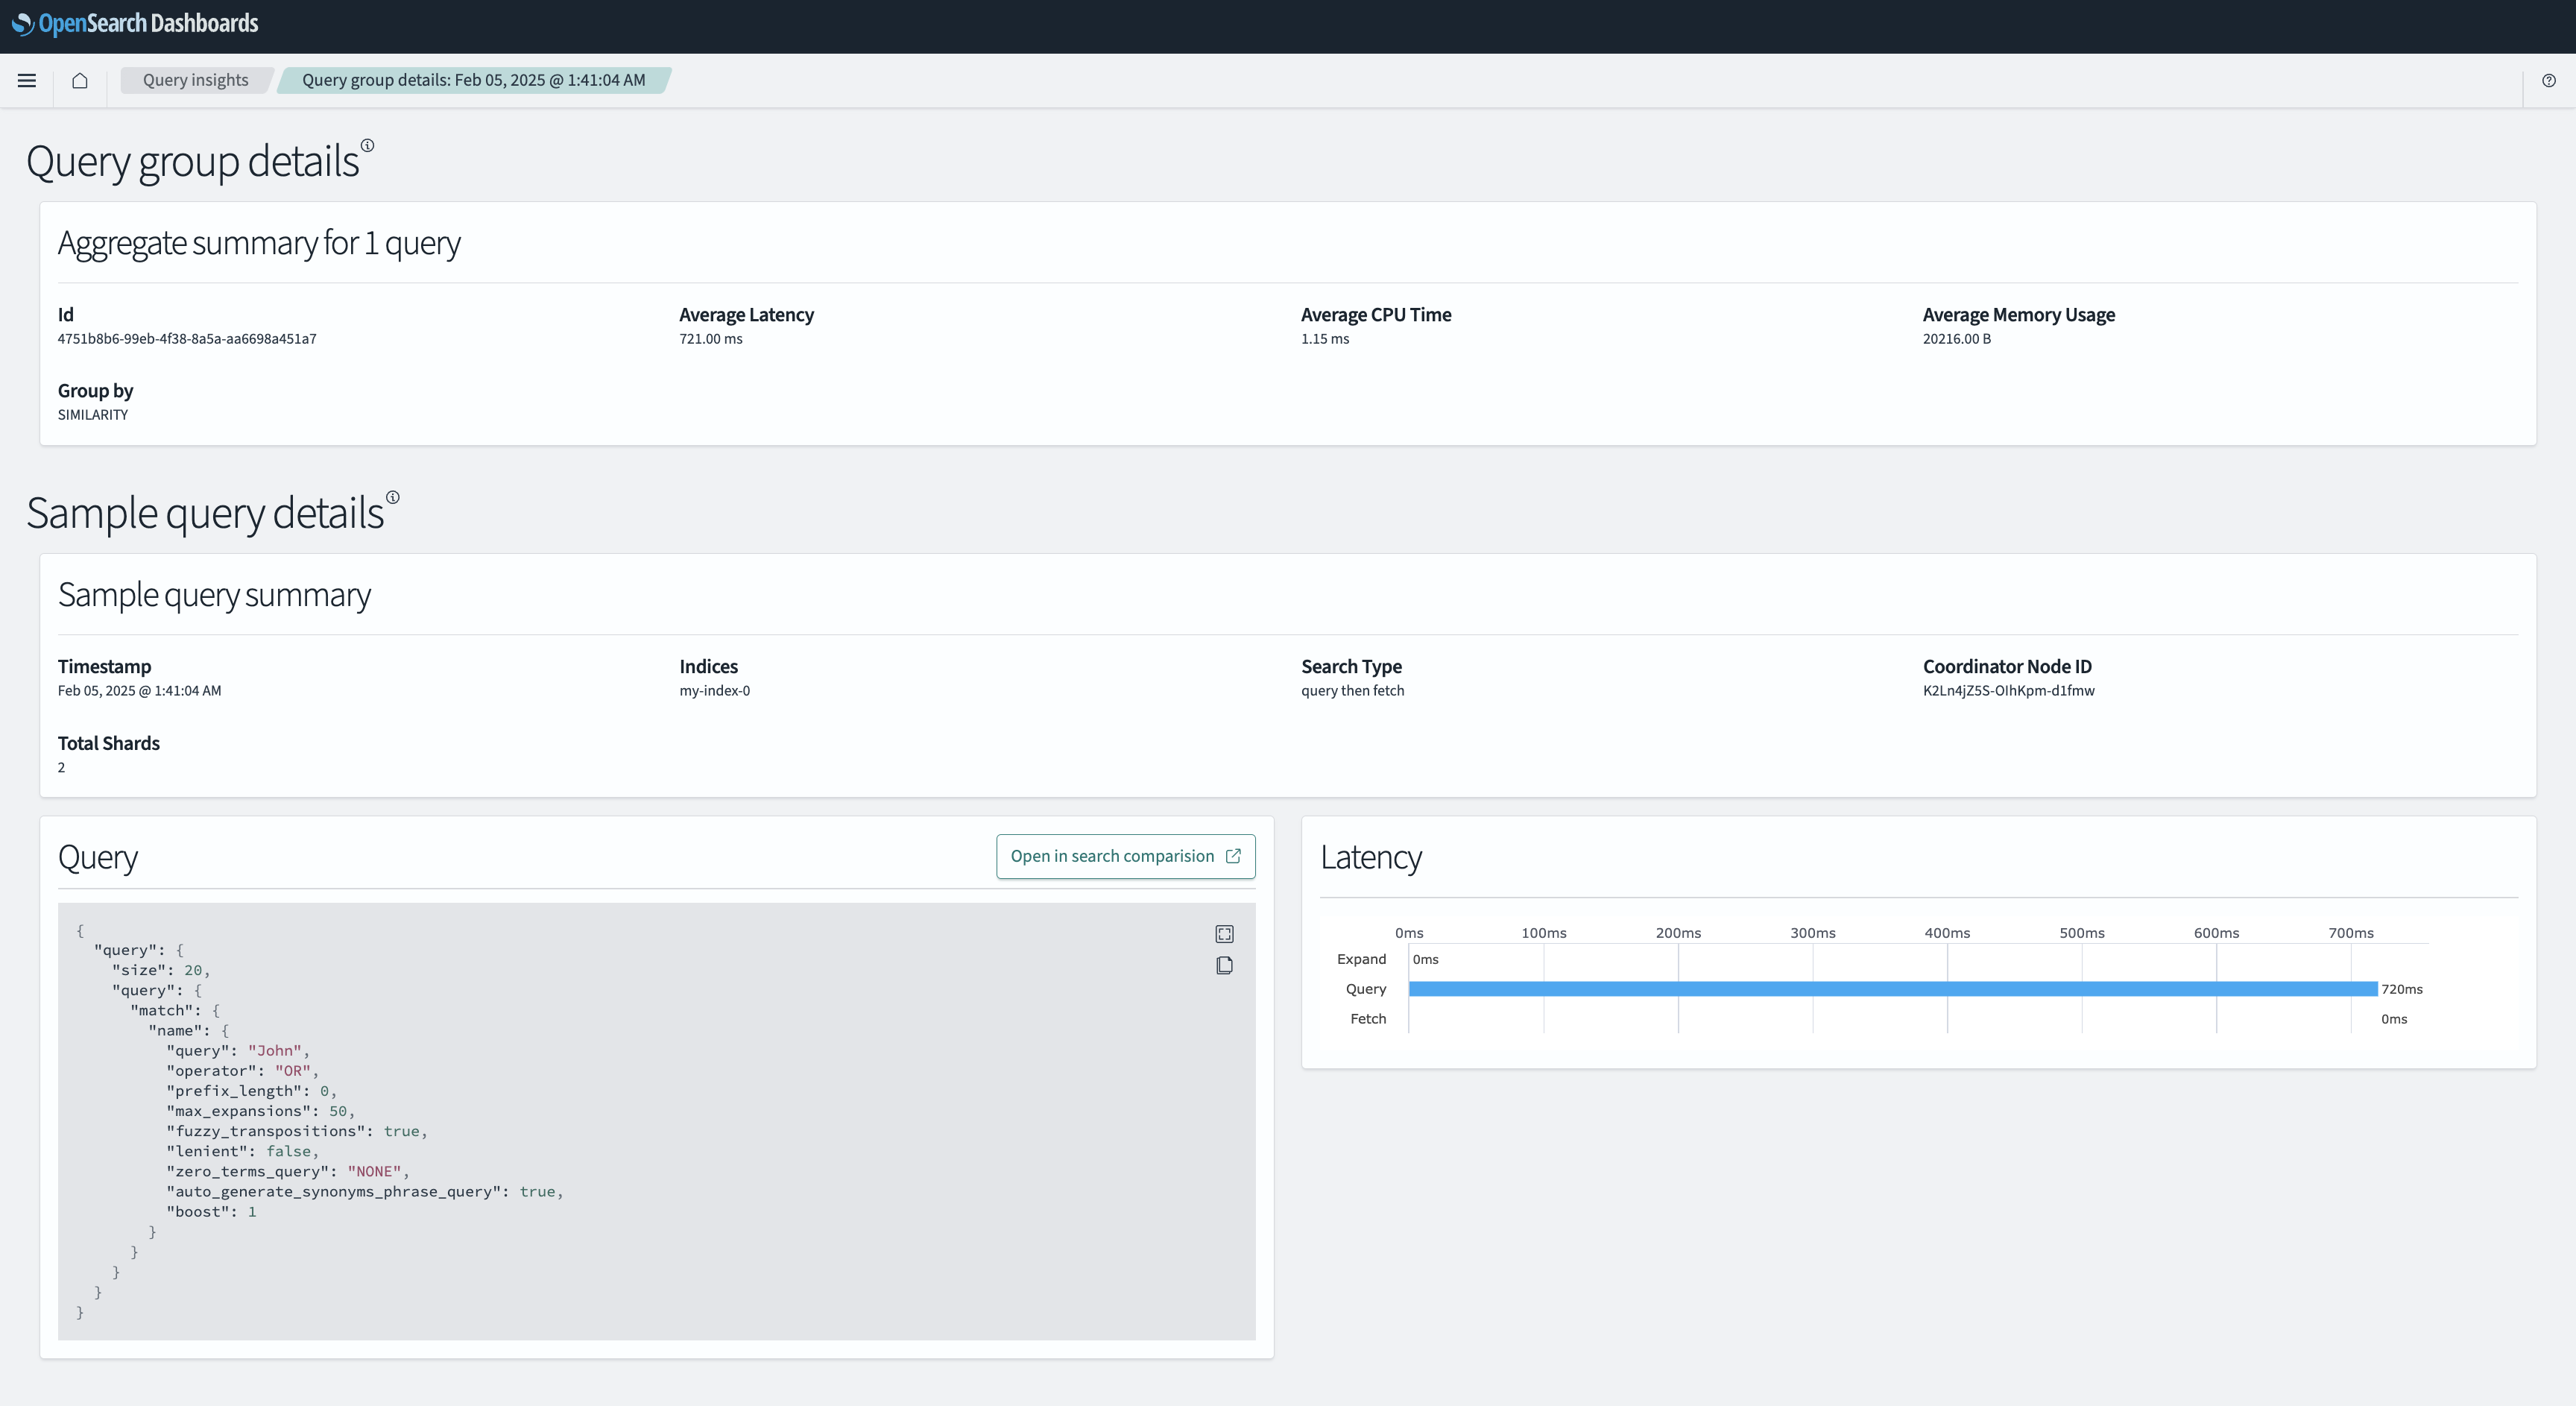
- The Aggregate summary for queries section provides a view of key query metrics for the entire group, including Average latency, Average CPU time, Average memory usage, and Group by criteria.
- The Sample query details section provides information about a single representative query, including its Timestamp, Indexes, Search Type, Coordinator Node ID, and Total Shards.
- The Query section displays the JSON structure of the query.
- The Latency section presents a graphical representation of the run phases for the query.
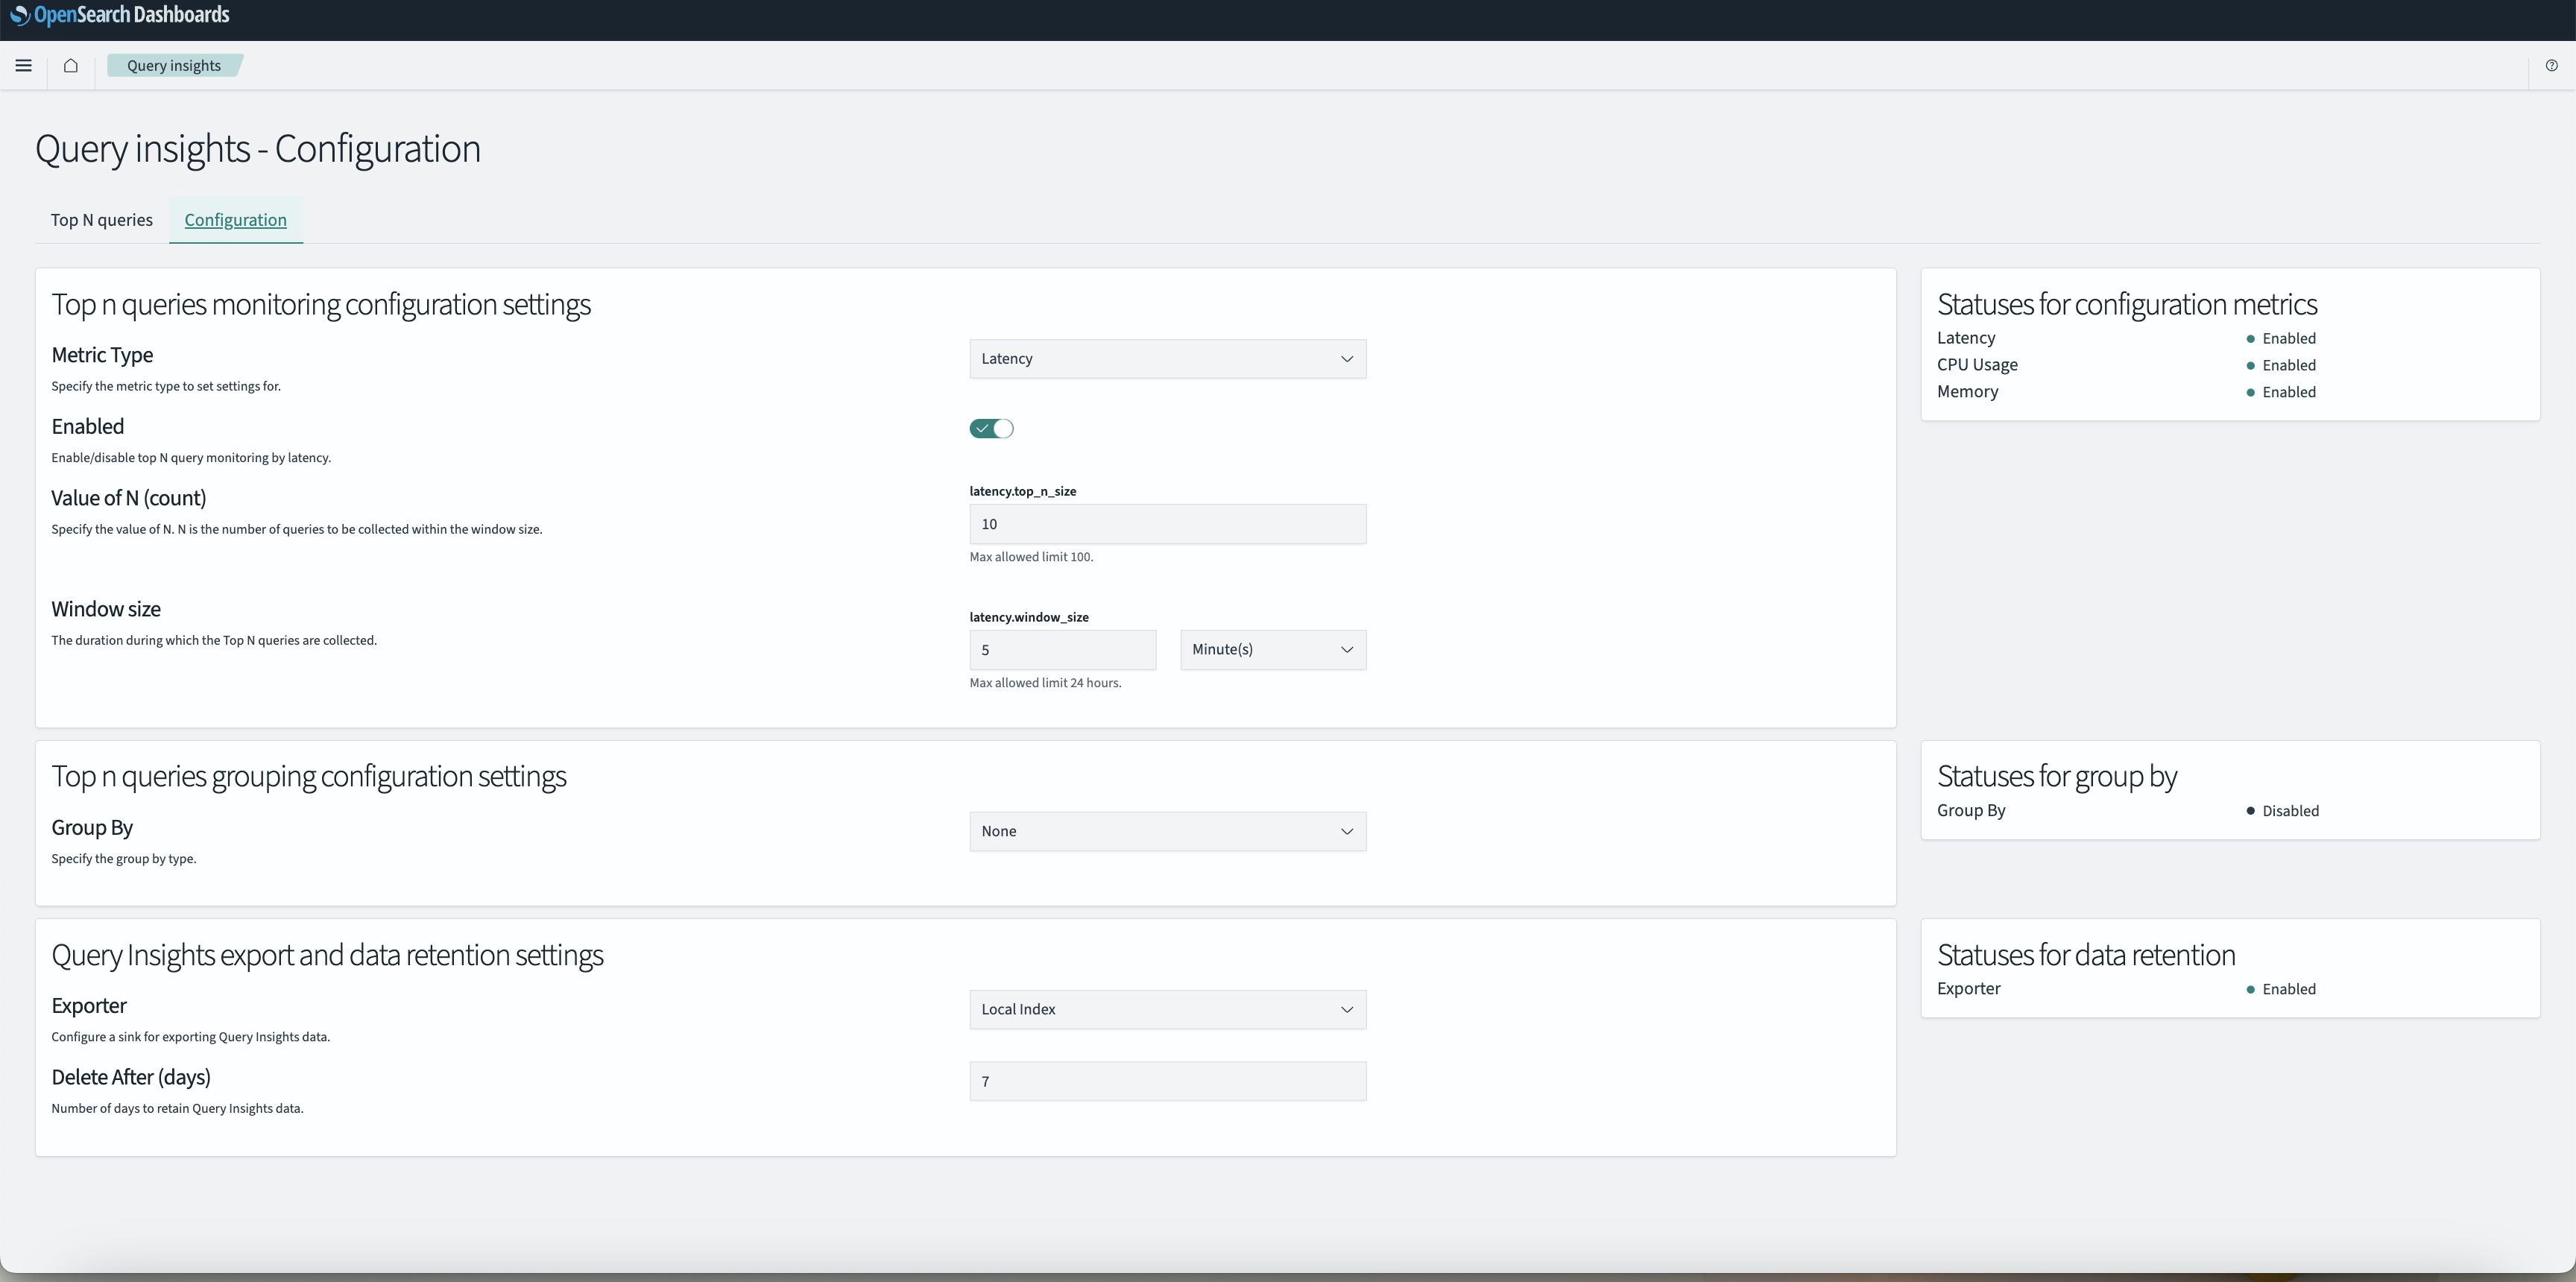
Configuration
The Query insights - Configuration page is designed to gives you control over how the query insights feature collects, monitors, groups, and retains data. The following image shows the configuration page.
On the configuration page, you can configure the settings described in the following sections.
Top N queries monitoring
The Top n queries monitoring configuration settings allow you to track query performance metrics, such as Latency, CPU Usage, and Memory, to analyze and optimize query performance. The configuration interface provides a structured, menu-driven setup through which you can define specific metrics to be monitored, set thresholds for analysis, and customize monitoring durations.
Perform the following to configure the top N queries settings:
- From the Query insights page, navigate to the Configuration tab.
- Select the metric type: Latency, CPU Usage, or Memory.
- Toggle the Enabled setting to turn the top N queries feature on or off for the selected metric.
- Specify the monitoring Window size, which determines the duration of the time queries collected for analysis.
- Enter the value of N, which defines the number of top queries to track in each window.
- Select Save.
- Check the Statuses for configuration metrics panel to see the enabled metrics.
Top N queries grouping
The Top n queries group configuration settings set the grouping settings for queries.
Use the following steps to set specific grouping attributes:
- Select a grouping option under Group By, such as Similarity.
- Select Save.
- Check the Statuses for group by panel to verify whether the Group by criteria is enabled.
Data export and retention
To configuring data export and retention, use the Query insights export and data retention settings panel. There, you can set the following settings:
- Under Exporter, choose a destination for the data, such as Local index.
- Set the Delete After (days) field with a data retention period.
- Select Save.
- In the Statuses for data retention panel, make sure that the Exporter setting is enabled.
Configuration best practices
When configuring the query insights feature, remember the following best practices:
- Begin with a smaller value for N (count) and increase it based on your system’s load.
- Choose your Window size carefully. A longer window size can save compute resources because the insights found are less granular. Inversely, a shorter window size can output more comprehensive query insights but uses more resources.
- When setting data retention periods, consider shorter retention periods that save storage but reduce the number of long-term insights.
- Enable metrics based on your monitoring needs. Monitoring fewer metrics prevents system overload.
Live queries
The Live queries page provides real-time visibility into search queries currently running in your OpenSearch cluster. It enables active monitoring, fast debugging, and insight into how a query’s load is distributed across nodes and indexes.
The following image shows the live queries view.
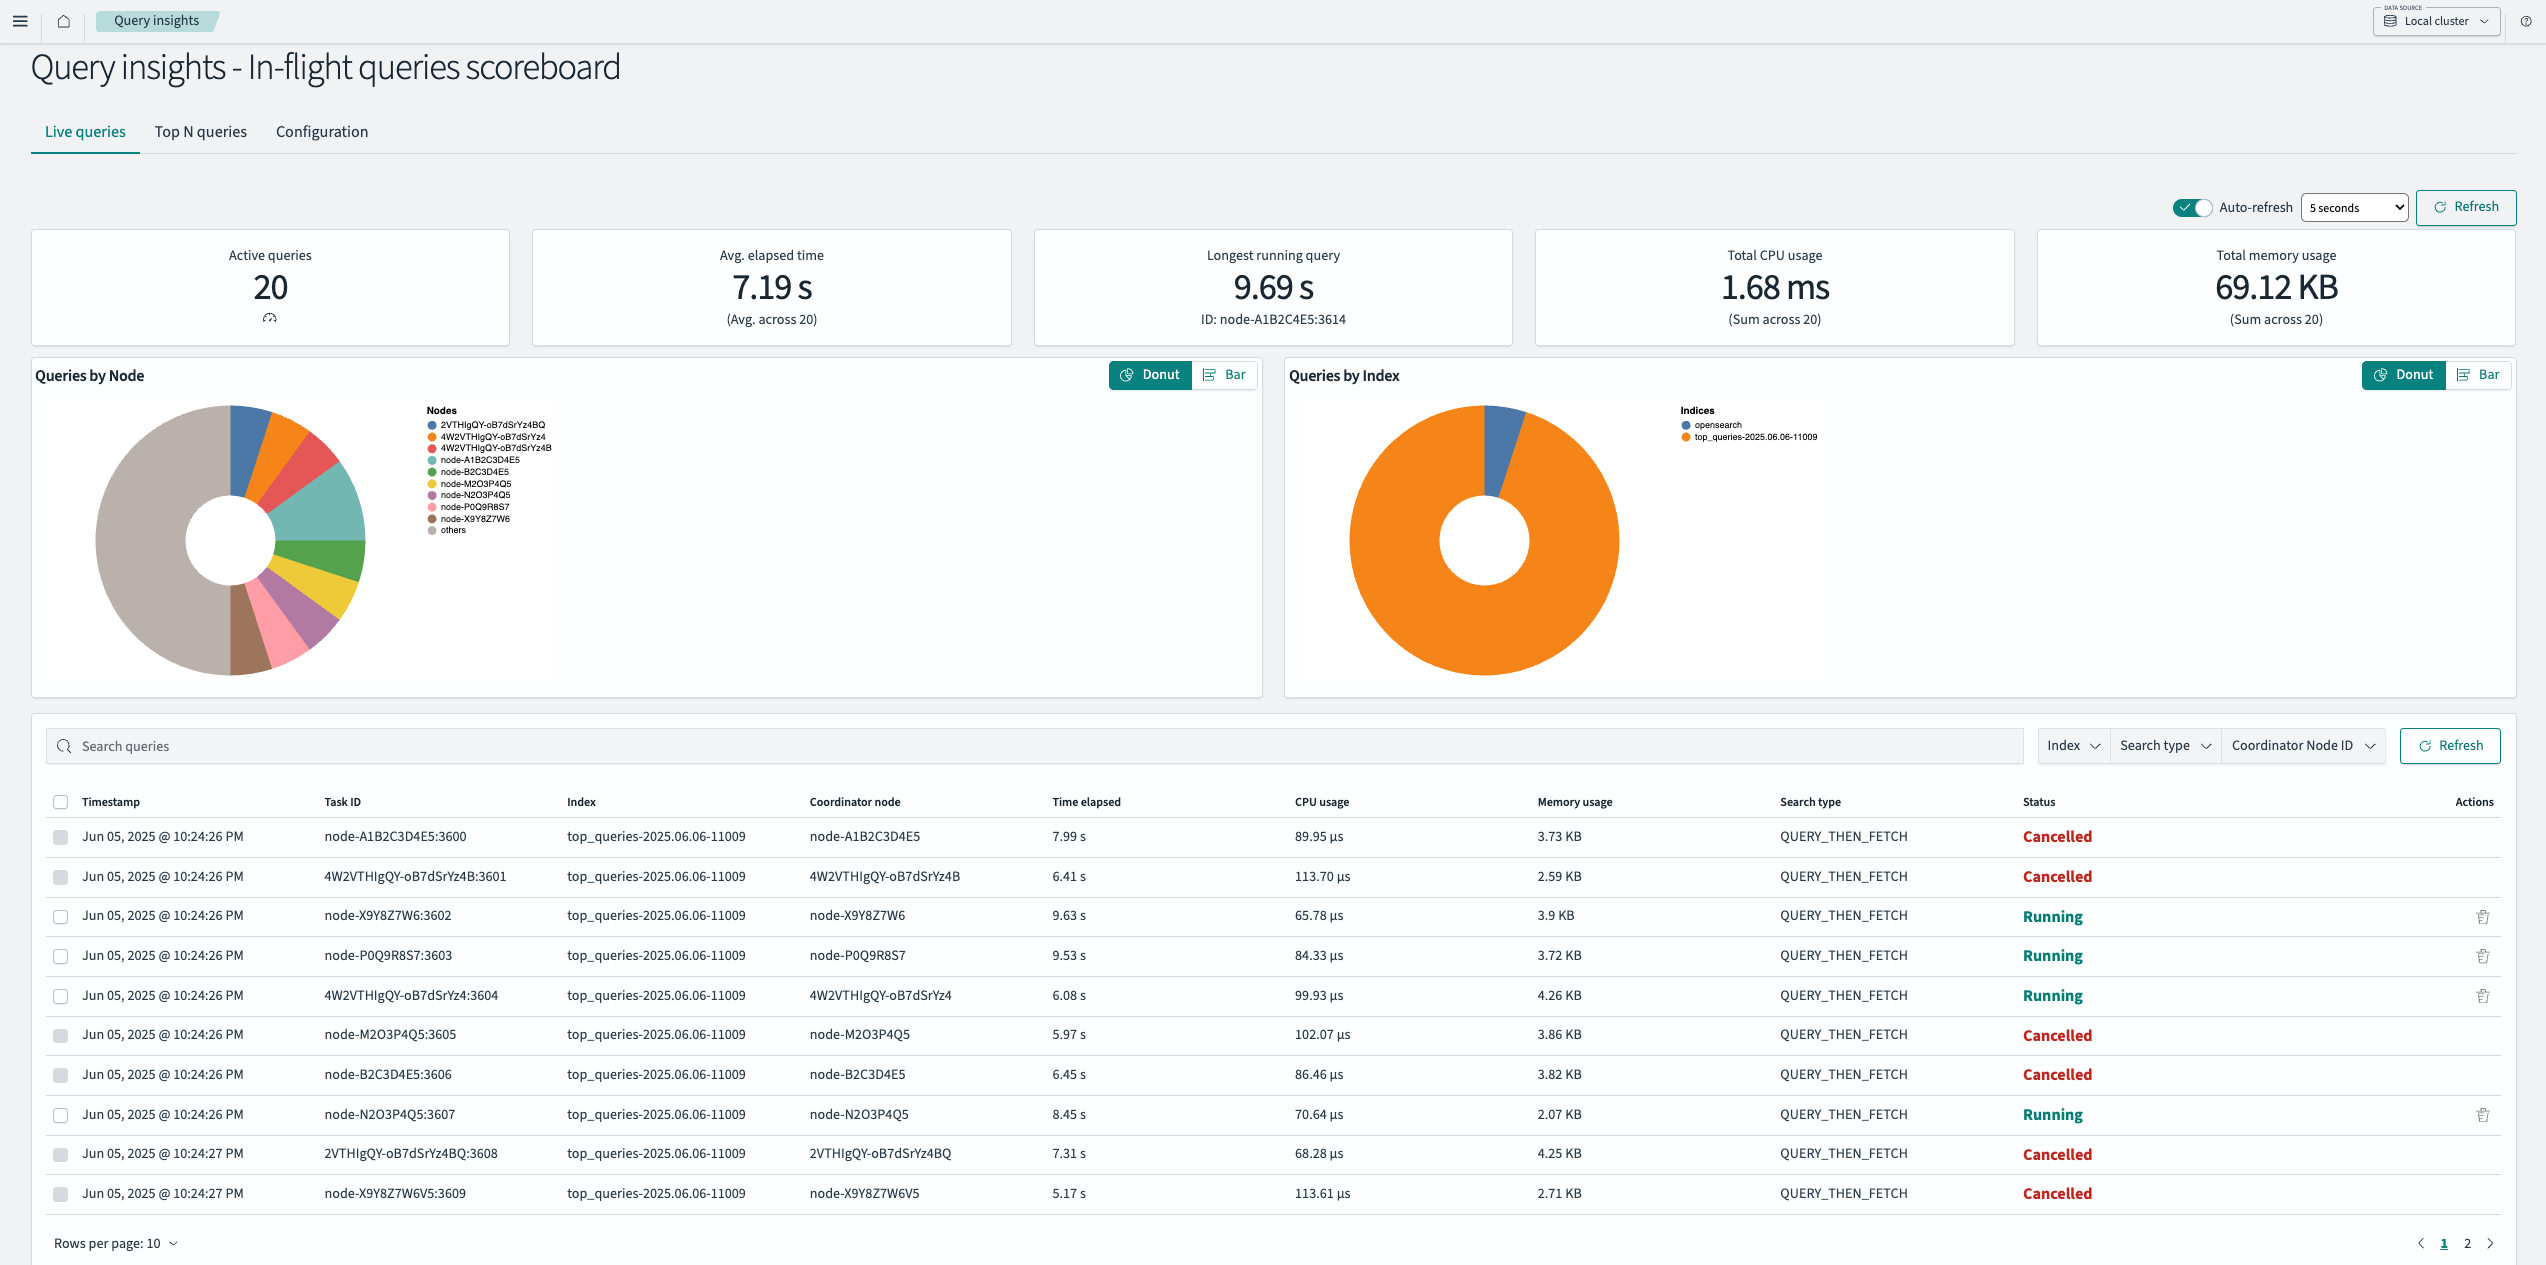
Metrics overview
The top panel in the live queries view displays the following key real-time metrics.
| Panel | Description |
|---|---|
| Active queries | The total number of queries currently running in the cluster. |
| Avg. elapsed time | The average execution time across all active queries. |
| Longest running query | The query ID and elapsed time of the longest currently running query. |
| Total CPU time | The cumulative CPU time consumed by all active queries. |
| Total memory usage | The total memory consumed by all active queries. |
| Total completions | The number of queries that have successfully completed. |
| Total cancellations | The number of queries canceled. |
| Total rejections | The number of queries rejected. |
Breakdown charts
Two visual charts provide breakdowns of query load:
- By node – Shows how many queries are running on each node.
- By index – Displays how many queries are targeting each index.
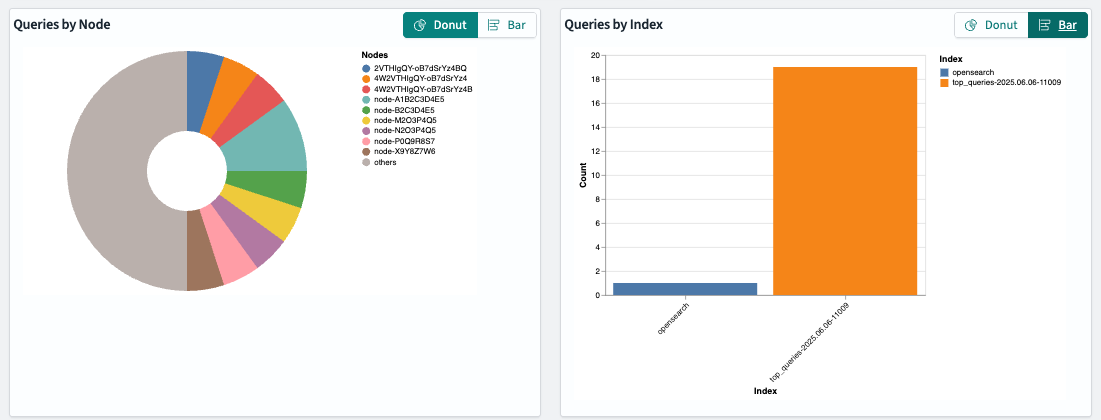
You can toggle between Donut and Bar chart formats using the chart type switch.
Only the top 9 items are displayed individually in the chart; additional values are grouped under the Others category.
Live queries table
The live queries table lists the following information for each live query.
| Column | Description |
|---|---|
| Timestamp | The time at which the query started running. |
| Task ID | The unique identifier for the query task. |
| Index | The index or indexes targeted by the query. |
| Node | The node currently running the query. |
| Time elapsed | The current execution time for the query, in seconds. |
| CPU usage | The cumulative CPU time consumed by the query. |
| Memory usage | The amount of memory consumed by the query during execution. |
| Search type | The search execution method, such as query_then_fetch. |
| Coordinator node | The node that coordinated the query execution. |
| WLM Group | The workload group associated with the query. Displayed as plain text if workload management (WLM) is disabled or as a clickable link to the WLM Group Details page associated with that query when WLM is enabled. |
| Status | The current status of the query. Values are running or cancelled. |
| Actions | The available actions for the query, such as canceling execution. |
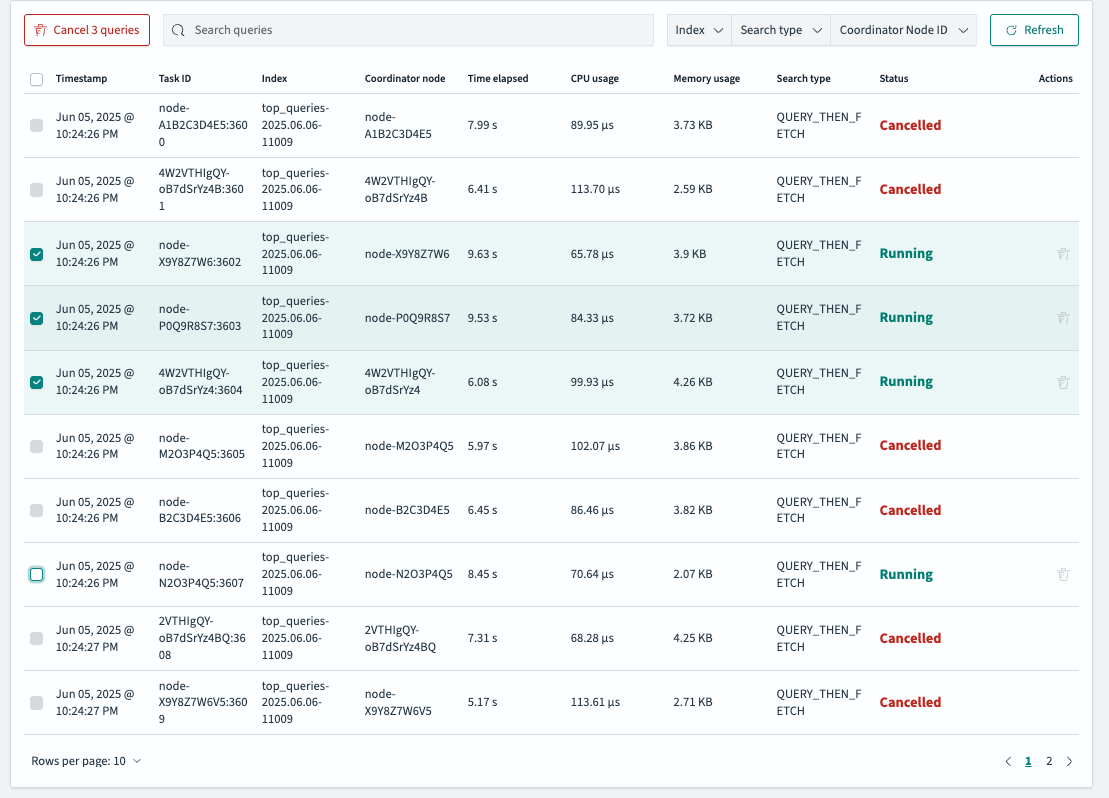
You can use the filter bar to search for queries by text or specific field values—such as node ID, index name, or task ID—and paginate the table to better analyze specific queries. The following image shows the live queries table view.
The live queries table provides the following real-time monitoring controls:
- Auto-refresh toggle – Enable or disable periodic data refresh.
- Refresh interval – Choose the refresh frequency. This option is available only when Auto-refresh is enabled.
- Manual refresh – Select the Refresh button to update immediately.
Workload group selector
The workload group selector lets you filter and analyze active queries by workload group:
- By default, the selector is set to All Workload Groups, showing queries across the cluster.
- When WLM is disabled, only the
DEFAULT_WORKLOAD_GROUPoption is available. - When WLM is enabled, the dropdown lists all available workload groups.
- Selecting a specific group filters the dashboard to show only queries running under that workload group.
- The metrics panels and charts update to display only the selected workload group.
Canceling live queries
The live queries table provides direct controls for canceling queries that are currently running in the cluster. This allows you to immediately stop problematic or resource-intensive searches without waiting for them to finish. You can cancel live queries in the following ways:
- Cancel an individual query:
- In the Actions column for the query you want to stop, select the trash can icon.
- When prompted, confirm the cancellation. Once the cancellation succeeds, the query status changes to
Cancelled.
- Cancel multiple queries in bulk:
- To select multiple queries, use the checkboxes to the left of the table. To select all queries, use the Select all checkbox in the table header.
- Select the Cancel selected button above the table.
- Confirm the cancellation for all selected queries. All selected queries are stopped and their statuses updated.