Trace analytics
Trace analytics provides a way to ingest and visualize OpenTelemetry data in OpenSearch. This data can help you find and fix performance problems in distributed applications.
Trace analytics is a classic observability app. In an Observability workspace, Trace analytics is not available when both APM and Discover Traces are enabled. To analyze traces in an Observability workspace, see Traces and Application performance monitoring.
A single operation, such as a user choosing a button, can trigger an extended series of events. The frontend might call a backend service, which calls another service, which queries a database, processes the data, and sends it to the original service, which sends a confirmation to the frontend.
Trace analytics can help you visualize this flow of events and identify performance problems, as shown in the following image.
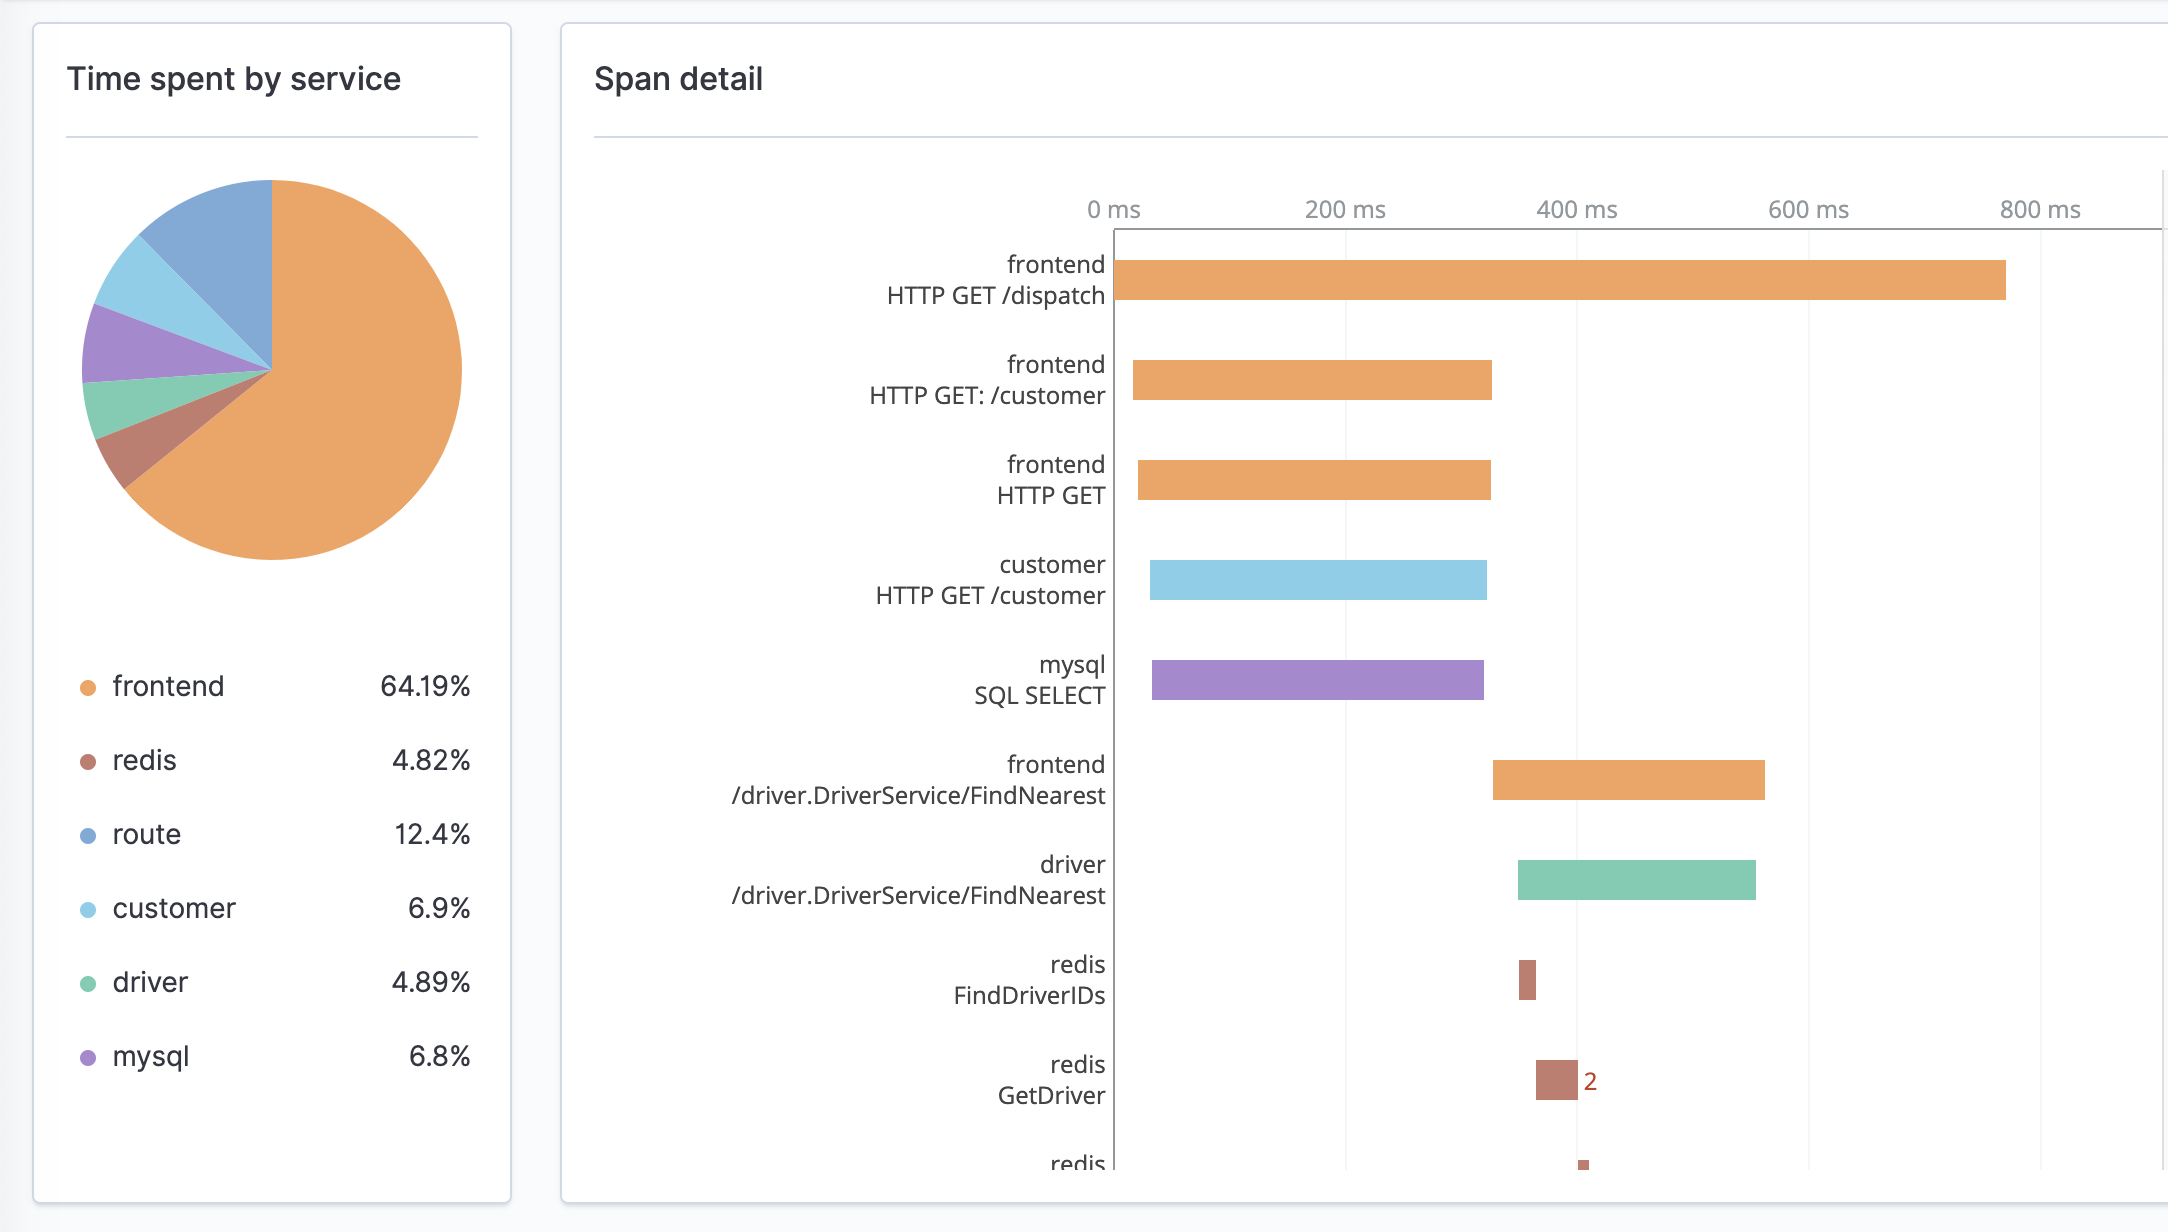
Trace analytics analyzes traces from your applications. OpenSearch can also generate traces for the requests that it processes. For more information, see Distributed tracing.
Trace analytics with Jaeger data
Trace analytics supports Jaeger trace data. If you use OpenSearch as the backend for Jaeger trace data, you can use the built-in Trace analytics capabilities.
To set up your environment to use Trace analytics, see Analyzing Jaeger trace data.