Exploring data with Discover
You can use the Discover application in OpenSearch Dashboards to explore and visualize your data in OpenSearch.
Prerequisites
The examples on this page use the Sample flight data dataset that is already installed in OpenSearch Playground.
If you’ve installed a local OpenSearch Dashboards instance, add the sample data by following these steps:
- On the OpenSearch Dashboards home page, select Add sample data.
- In the Sample flight data panel, select Add data.
For more information, see Adding sample data.
Navigating the Discover UI
The following image shows the main components of the Discover application.
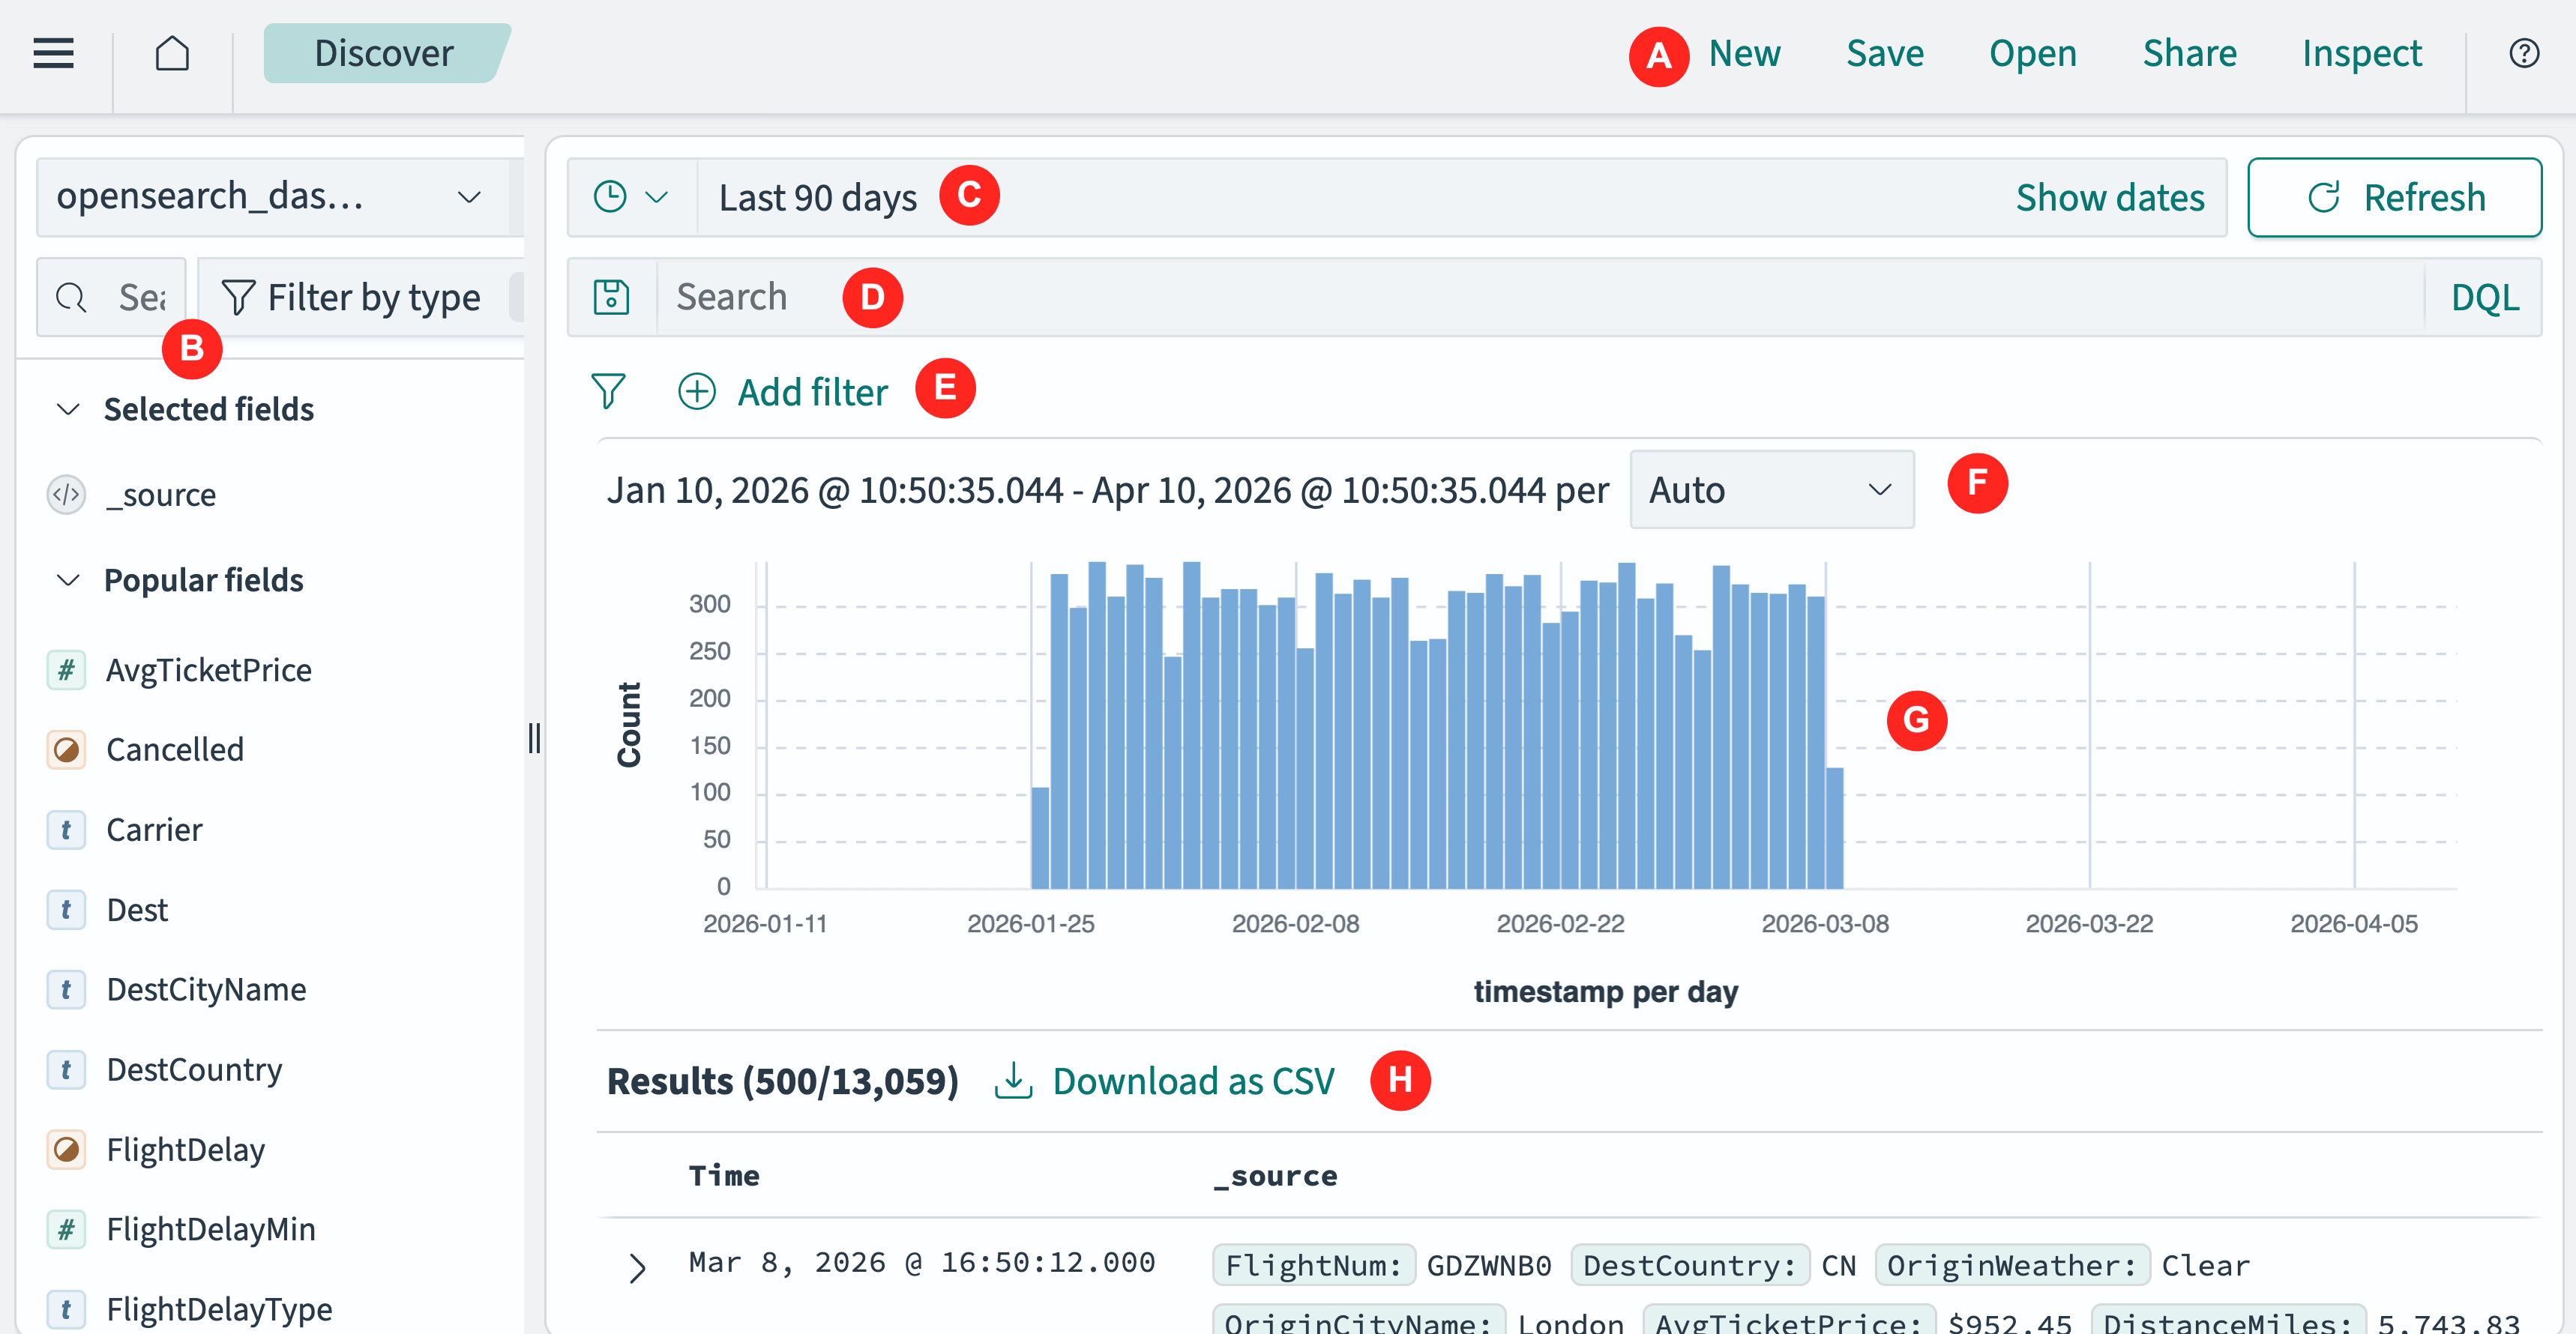
- The application menu (A) provides options for creating and saving Discover filters settings.
- The field select tool (B) determines which fields display in the Discover application panel. See Using the field select tool.
- The time filter (C) provides a graphical interface for selecting data values and ranges. See Using the time filter.
- The search bar (D) enables selection of data using a query language search. See Using the search bar.
- The filter tool (E) contains frequently used commands and shortcuts. See Using the filter tool.
- The Discover application panel displays the following elements:
- The date range display (F) specifies and selects a date-time range and determines the scale of the timeline visualization.
- The timestamp histogram (G) displays the count of documents per time interval.
- The Results table (H) displays summaries of the selected documents. You can expand each document and view it in tabular or JSON form.
If there is no data selected, the application panel displays a </> No Results message. This often happens, especially with the OpenSearch Dashboards sample data, because all data falls outside the time filter interval.
The time filter interval defaults to Last 15 minutes. To change the time filter interval, Expand the time range to include data.
Viewing the Results table
The Results table displays the selected data. Each row represents a single document, and each column contains document attributes.
By default, the table shows all attributes for all selected documents.
To display documents in the Discover application, follow these steps:
-
In the navigation panel, select OpenSearch Dashboards > Discover.
-
Choose the data you want to work with from the Index patterns dropdown in the field select tool. See Selecting an index pattern.
For the following example, choose
opensearch_dashboards_sample_data_flights. -
Use the time filter to select the time interval of interest. See Selecting a time range.
For the example, select Last 12 months.
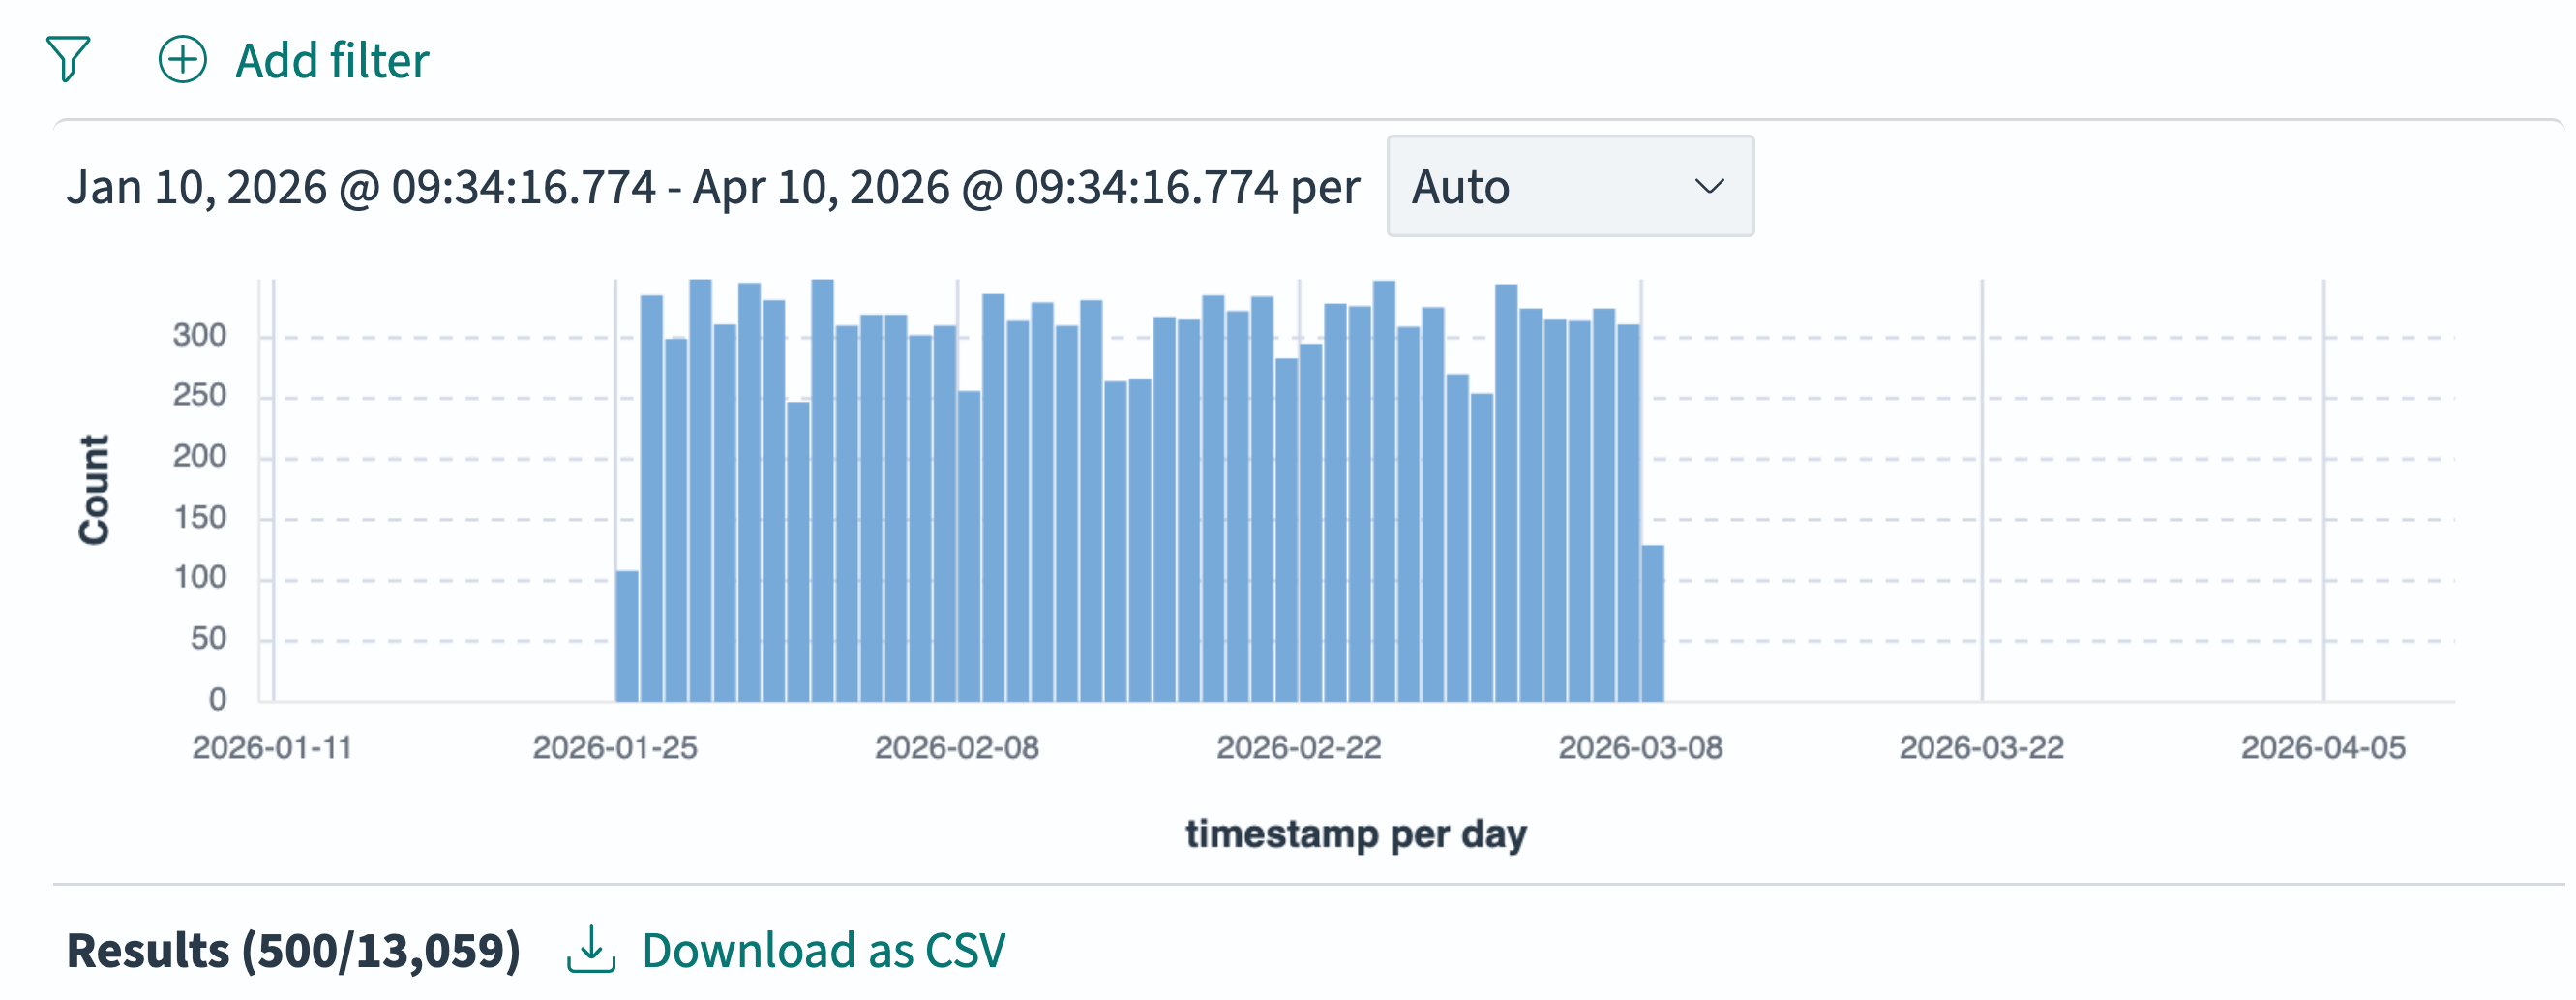
The following image shows the resulting display in the Discover app.
-
Drag-select the narrow band of data from the timestamp histogram as shown in the following image.
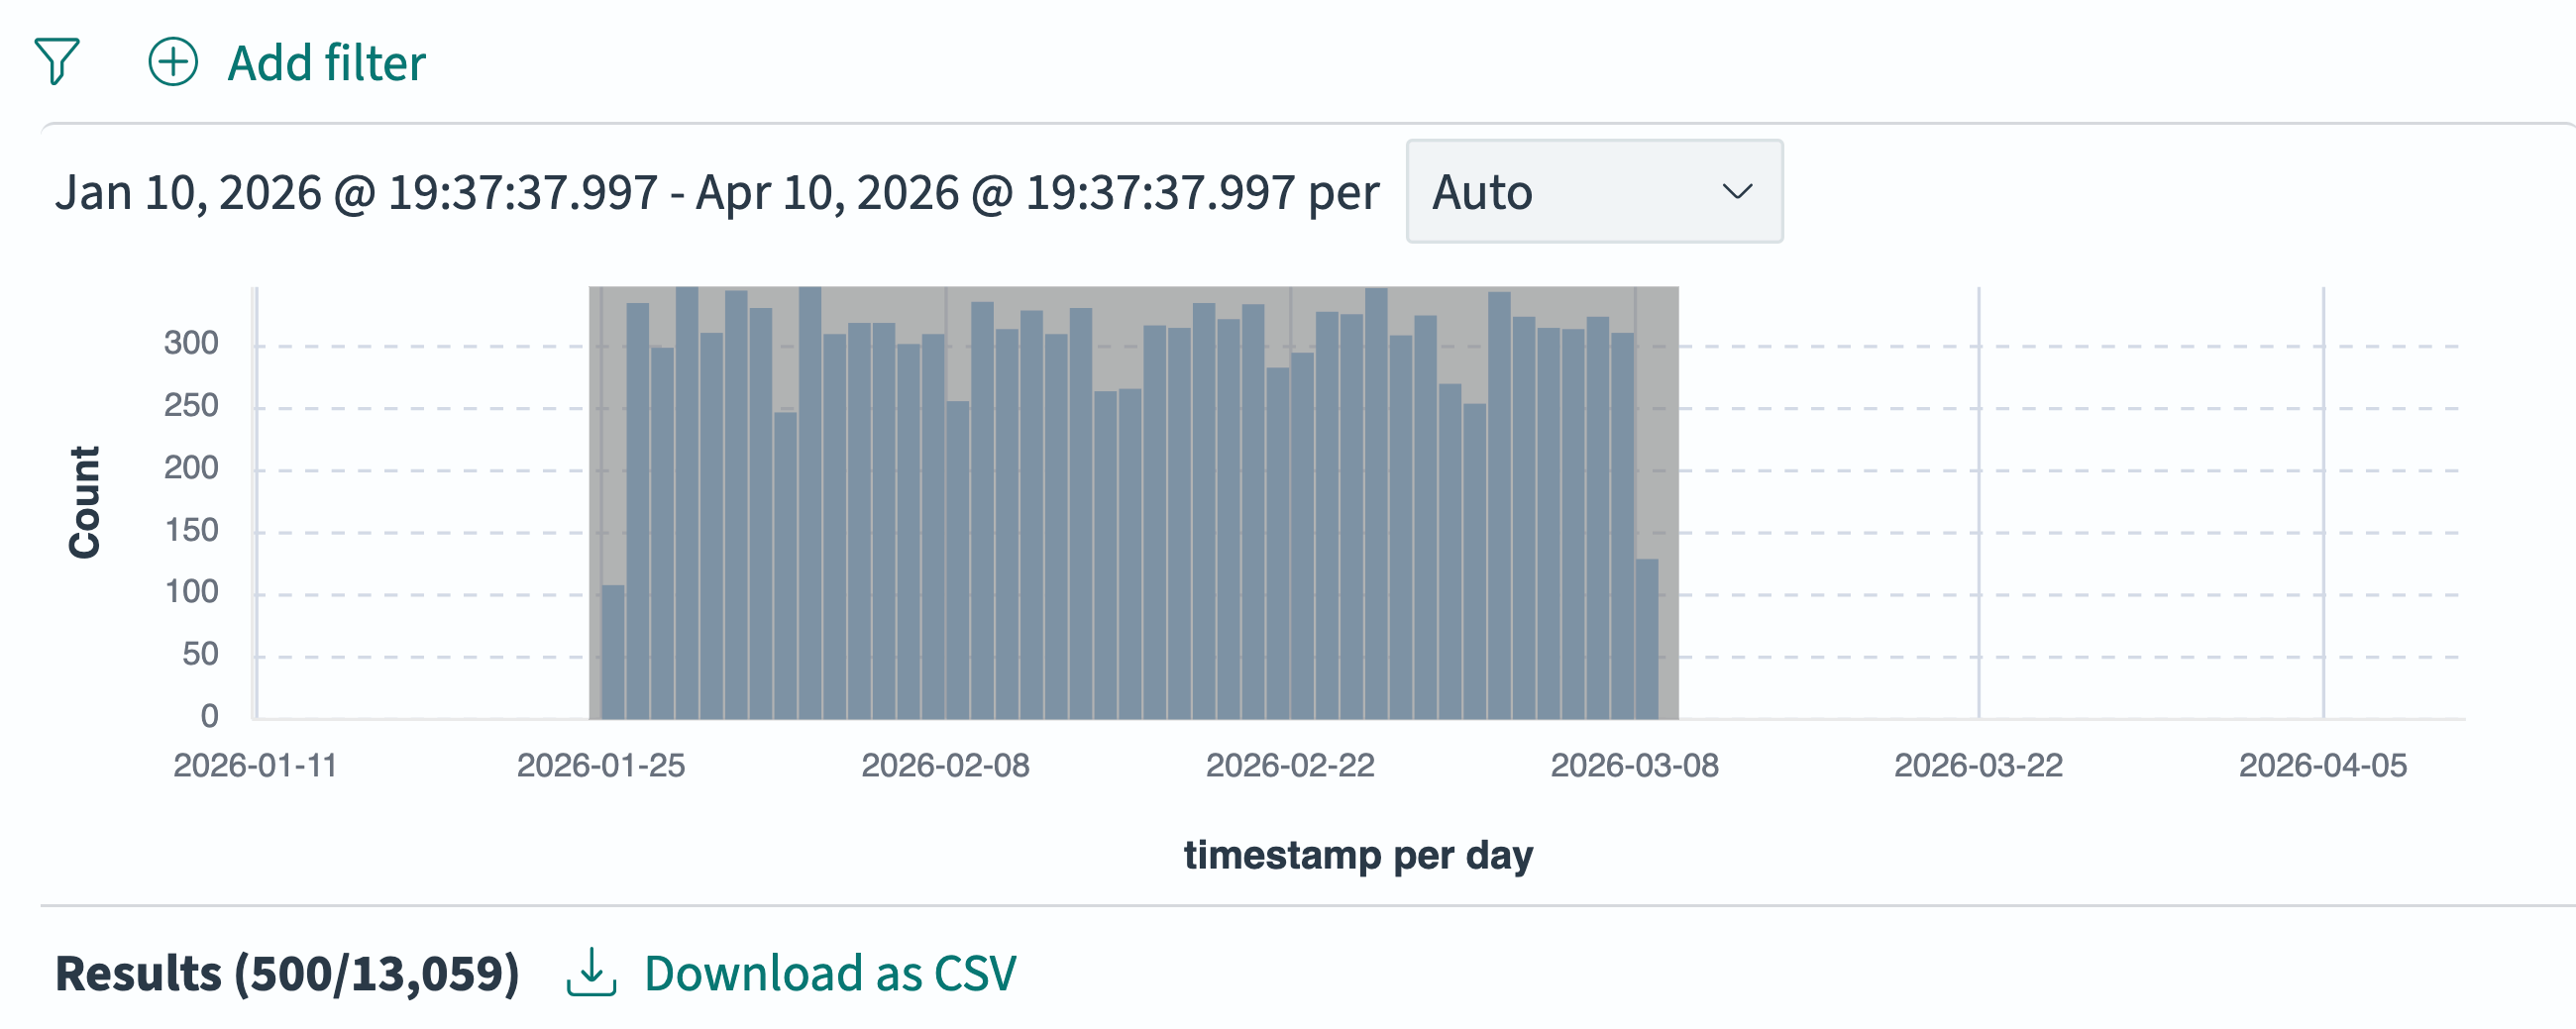
The data adjusts to span the width of the data display, and the scale adjusts automatically.
Selecting a date range interactively results in an absolute time interval.
-
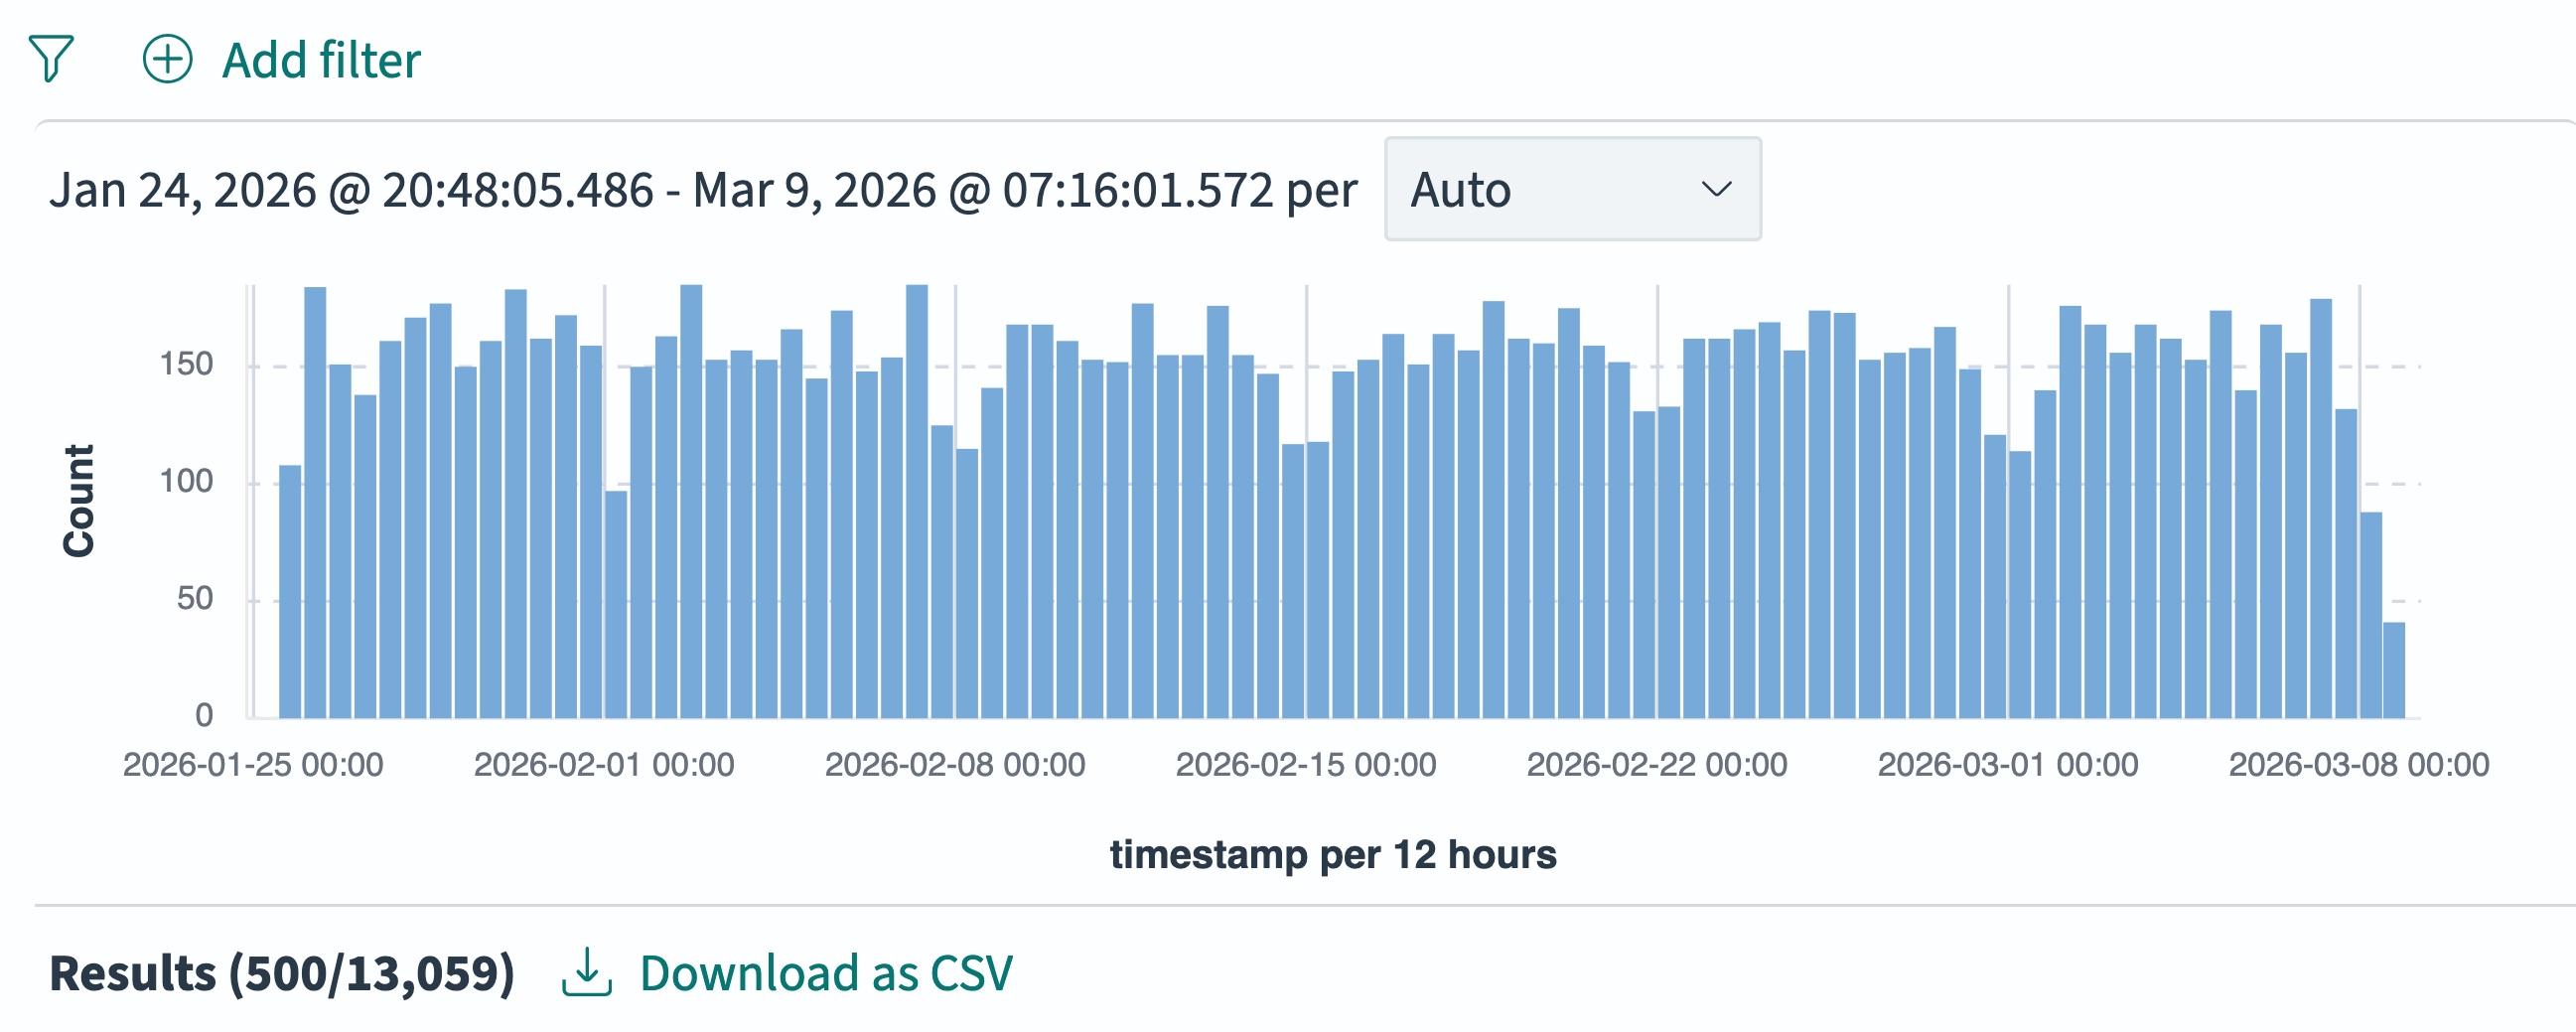
Select Auto from the date range display drop-down.
The resulting view should look like the following image.
Filtering documents
You can filter documents out of the selected index pattern in several ways:
- By further refining the time interval
- By entering a query language query
- By selecting attribute values in a menu-based filter tool
You can save any combination of these filters and re-apply them later to the same or a different index pattern. See Saving a query.
Refining the time interval
The Discover application displays only the documents that are included in the time filter’s time interval. The time interval can be relative (a fixed window of time relative to now), or absolute (between two fixed times).
Some tools for changing the time interval are demonstrated in the previous example. To learn about others, see Using the time filter.
Entering a query
You can filter documents by entering a query string in the search bar using one of two query languages.
- Dashboards Query Language (DQL) is the default query language in the search bar and is available only in Dashboards.
- Query string query language (Lucene) is based on the Apache Lucene query language.
To filter documents using the search bar, see Using the search bar.
For example, using the flights sample data, enter the following DQL search:
Carrier: "OpenSearch-Air"
Selecting attribute values
You can use the filter tool to add any number of discrete filters based on attribute values.
You can turn filters on or off individually or all at once; reverse the inclusion-exclusion status of any filter; and pin the filters as a group so that they apply to the Dashboards and Visualization applications.
To use the filter tool, see Using the filter tool.
For example, using the flights sample data, use the filter tool to enter the following filter:
Choosing data fields
By default, the Discover application displays all the fields in a document. You can choose to display one, more, or all fields in the Results table.
To choose the fields to display in the Results table, see Using the field select tool.
For example, select Dest, FlightDelayMin, and FlightDelayType in the field select tool. The Results table now displays only those fields (in addition to the Time).
Examining a document
To expand a single document and see a detailed view in the Results table, follow these steps:
-
From a row in the Results table’s left column, select the
 (expand) icon to open the Document Details window.
 -
(Optional) To display the document in JSON format, select the JSON tab under the Expanded document label.
-
To return to the (default) tabular view, select the Table tab.
-
(Optional) To view documents preceding or following the current document, select View surrounding documents.
The document, along with the five documents before and after by default, are displayed in a new browser window.
The number of surrounding documents is fewer if there are fewer documents immediately before or after.
-
(Optional) To view the expanded document in isolation, select View single document.
The expanded document is displayed in a new browser window.
-
To close the Expanded document window, select the
 (down arrow) icon.
Visualizing data fields
To visualize a data field, follow these steps:
-
In the field select list, mouse over the field you want to visualize.
-
Select the
 (inspect) icon to the right of the field name.
The Top 5 views popover displays as shown in the following image.
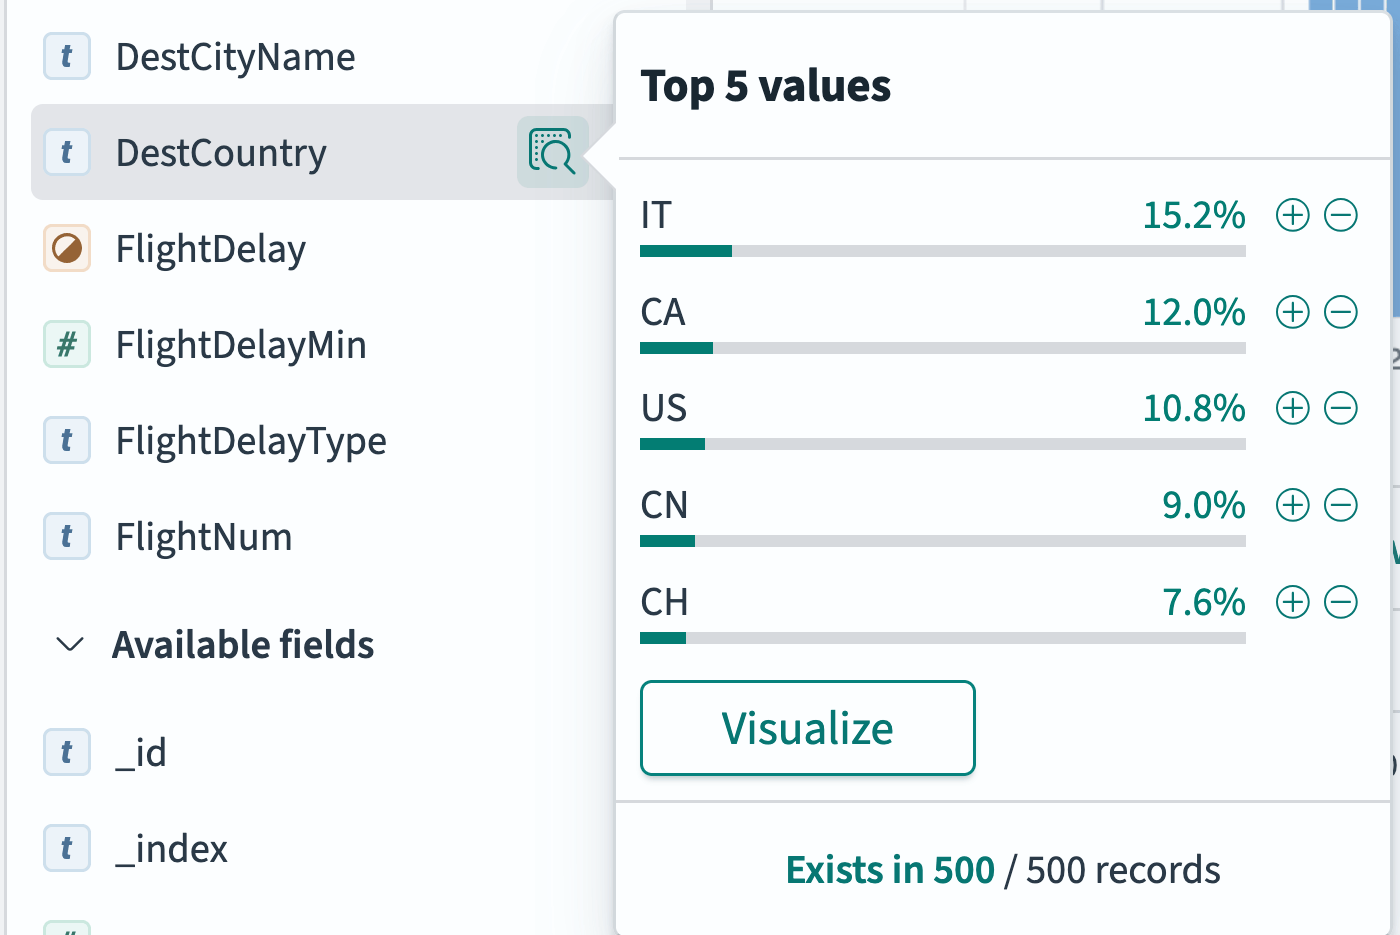
-
From the Top 5 values popover, select the Visualize button. The display changes to the Visualize application, showing a default visualization of the selected field.
See Building data visualizations to learn how to edit the visualization display.
Exporting data
You can export data from the Results table to a CSV file or copy a JSON object representing a single document.
Downloading data to a CSV file
To download a CSV-formatted file of data from the Results table:
-
Filter the data to the documents you want to export as described in Filtering documents.
-
Choose the data fields you want to export as described in Choosing data fields.
-
Select Download as CSV.
-
In the DOWNLOAD AS CSV popover, choose whether you want to download only the documents Visible on the page, or the Max available (all selected documents, limited to 10,000 documents).
-
Select the Download CSV button.
The data is written to a CSV file at the filesystem’s default location.
If the selected fields include objects or arrays, the CSV documents will download as JSON objects. To download as discrete CSV values, select only single-value fields.
Copying a JSON representation of a document
To copy a JSON representation of a document, follow these steps:
-
Select the individual document in the Results table. See Examining a document.
-
Select the JSON tab to view the document in JSON form.
-
Select the
 (copy) icon in the upper right of the JSON display area.
Setting alerts
You can set thresholds for data values and then set alerts to notify you when your data exceeds your thresholds.
To learn about creating and managing alerts, see Alerting dashboards and visualizations.