Configuring anomaly alerting
Once you’ve created an anomaly detector, you can configure alerting to be notified when anomalies occur. To configure alerting, create an alert monitor, shown in the following image. For instructions on how to to create an alert monitor, see Creating an alert monitor.
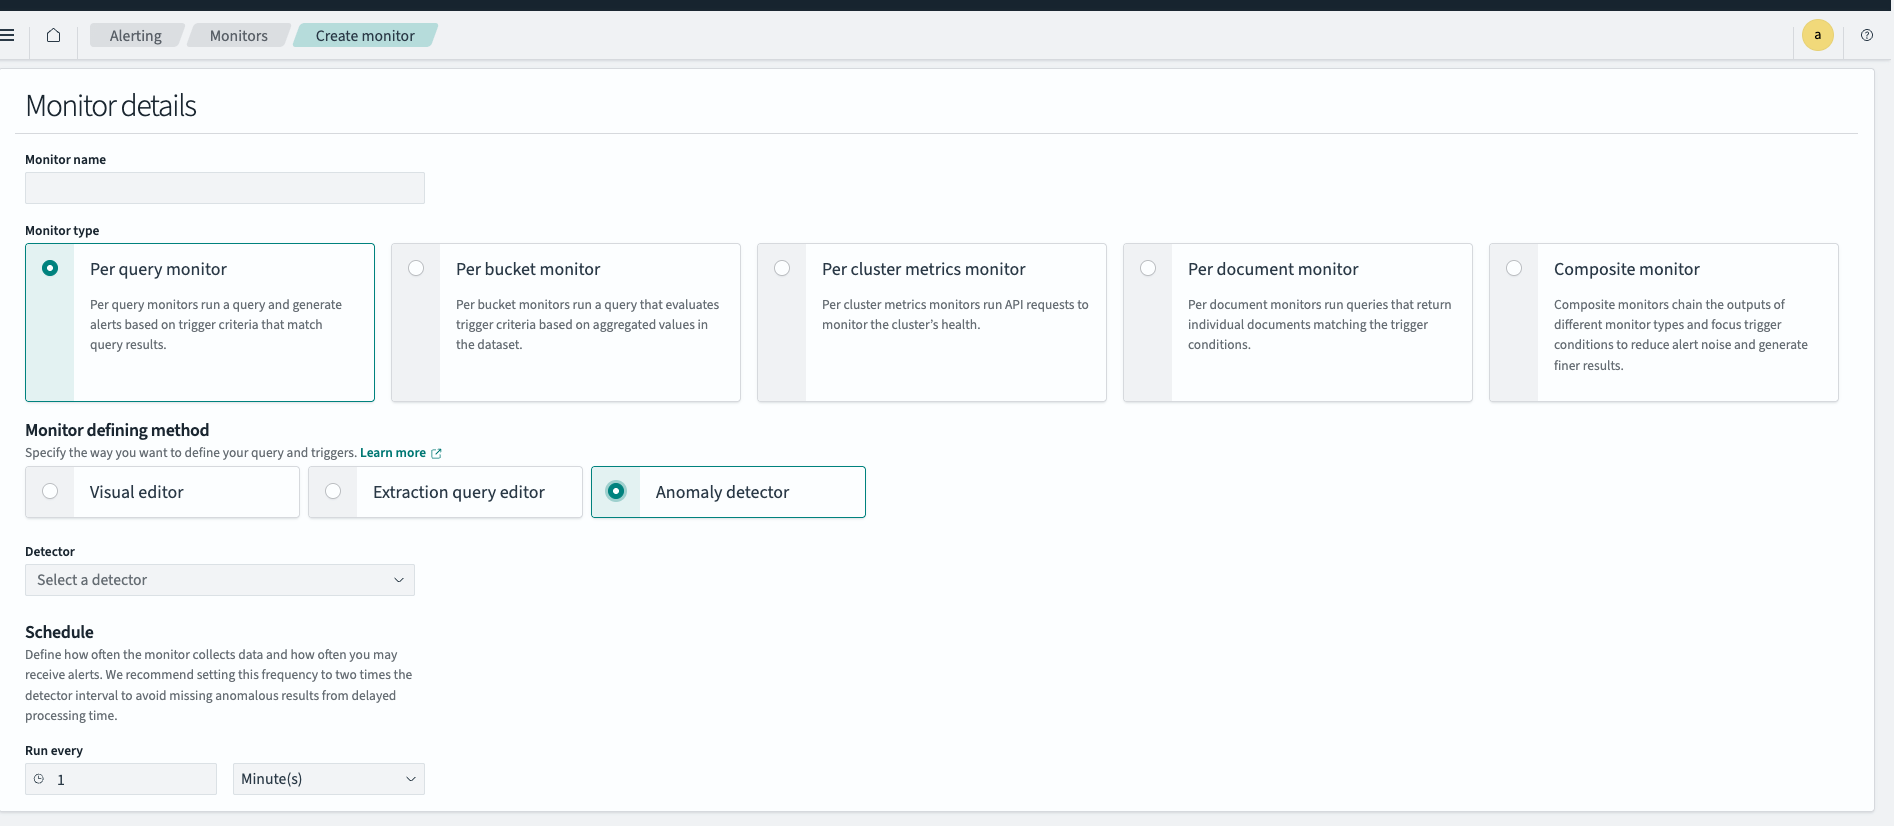
In Monitor defining method, choose one of these methods to define your monitor:
- Anomaly detector: Use when monitoring an individual detector’s results with thresholds on anomaly grade and confidence.
- Extraction query editor: Use when monitoring multiple detectors, writing complex queries, or creating advanced trigger conditions.
Example alert monitor
The following monitor is designed for a high-cardinality detector. You can modify the schedule, query, and aggregation to match your specific use case:
{
   "name": "ad-monitor",
   "type": "monitor",
   "monitor_type": "query_level_monitor",
   "enabled": true,
   "schedule": {
      "period": {
         "unit": "MINUTES",
         "interval": 2
      }
   },
   "inputs": [
      {
         "search": {
            "indices": [
               ".opendistro-anomaly-results*"
            ],
            "query": {
               "size": 1,
               "sort": [
                  {
                     "anomaly_grade": "desc"
                  },
                  {
                     "confidence": "desc"
                  }
               ],
               "query": {
                  "bool": {
                     "filter": [
                        {
                           "range": {
                              "execution_end_time": {
                                 "from": "{{period_end}}||-2m",
                                 "to": "{{period_end}}",
                                 "include_lower": true,
                                 "include_upper": true
                              }
                           }
                        },
                        {
                           "term": {
                              "detector_id": {
                                 "value": "oJzeoZkB8KmRTvydzJDF"
                              }
                           }
                        }
                     ]
                  }
               },
               "aggregations": {
                  "max_anomaly_grade": {
                     "max": {
                        "field": "anomaly_grade"
                     }
                  }
               }
            }
         }
      }
   ],
   "triggers": [
      {
         "query_level_trigger": {
            "id": "i5zuoZkB8KmRTvydn5Hg",
            "name": "ad-trigger",
            "severity": "1",
            "condition": {
               "script": {
                  "source": "return ctx.results != null && ctx.results.length > 0 && ctx.results[0].aggregations != null && ctx.results[0].aggregations.max_anomaly_grade != null && ctx.results[0].hits.total.value > 0 && ctx.results[0].hits.hits[0]._source != null && ctx.results[0].hits.hits[0]._source.confidence != null && ctx.results[0].aggregations.max_anomaly_grade.value != null && ctx.results[0].aggregations.max_anomaly_grade.value > 0.7 && ctx.results[0].hits.hits[0]._source.confidence > 0.7",
                  "lang": "painless"
               }
            },
            "actions": [
               {
                  "id": "notification606448",
                  "name": "ad-action",
                  "destination_id": "fpzsoZkB8KmRTvydkZGQ",
                  "message_template": {
                     "source": "Monitor **{{ctx.monitor.name}}** entered **ALERT** state — please investigate.\n\nTrigger    : {{ctx.trigger.name}}\nSeverity   : {{ctx.trigger.severity}}\nTime range : {{ctx.periodStart}} → {{ctx.periodEnd}} UTC\n\nEntity\n{{#ctx.results.0.hits.hits.0._source.entity}}\n  • {{name}} = {{value}}\n{{/ctx.results.0.hits.hits.0._source.entity}}\n",
                     "lang": "mustache"
                  },
                  "throttle_enabled": true,
                  "subject_template": {
                     "source": "Alerting Notification action",
                     "lang": "mustache"
                  },
                  "throttle": {
                     "value": 2,
                     "unit": "MINUTES"
                  }
               }
            ]
         }
      }
   ],
   "ui_metadata": {
      "schedule": {
         "timezone": null,
         "frequency": "interval",
         "period": {
            "unit": "MINUTES",
            "interval": 2
         },
         "daily": 0,
         "weekly": {
            "tue": false,
            "wed": false,
            "thur": false,
            "sat": false,
            "fri": false,
            "mon": false,
            "sun": false
         },
         "monthly": {
            "type": "day",
            "day": 1
         },
         "cronExpression": "0 */2 * * *"
      },
      "monitor_type": "query_level_monitor",
      "search": {
         "searchType": "ad",
         "timeField": "",
         "aggregations": [],
         "groupBy": [],
         "bucketValue": 1,
         "bucketUnitOfTime": "h",
         "filters": []
      }
   }
}
Note the following key configuration in the example alert monitor:
-
"size": 1in the search input: Retrieves a single document so you can referencectx.results.0.hits.hits.0in the notification to identify which entity (such ashostorservice) triggered the alert. -
execution_end_timerange"||-2m"→"": Filters results based on detectorexecution_end_time—the time the detector finishes running and indexes the result. Because OpenSearch operates in near real time (results are not immediate), indexing and refresh operations introduce a delay before a document becomes searchable. To account for this write-to-search latency, this example includes a small overlap (-2m). Specify the overlap based on your system’s worst-case delay. Avoid usingdata_end_time(the bucket’s logical end), which can miss results that arrive later. -
"indices": [".opendistro-anomaly-results*"]: Matches the default result index pattern. Update this pattern if you route results to a custom index, such asopensearch-ad-plugin-result-abc*. -
"detector_id": {"value": "oJzeoZkB8KmRTvydzJDF"}(optional): Use this filter to target a specific detector and avoid matching unrelated anomalies from other detectors. -
"max_anomaly_grade"aggregation: Detects the most severe anomaly in the time window. You can use any field in the anomaly result index for aggregation. For additional fields, see the Anomaly result mapping. -
Monitor schedule every 2 minutes: Evaluates results every 2 minutes to detect anomalies quickly. Combined with a 2-minute alert throttle, this avoids duplicate notifications for the same event.
-
Trigger condition
max_anomaly_grade.value > 0.7 && confidence > 0.7: Sets appropriate thresholds that reliably indicate anomalies. Adjust these values based on your tolerance for false positives and negatives. -
Mustache template with entity block: Displays both single-dimension (
host=server_3) and multi-dimension (host=server_3,service=auth) entity values in the notification. You can also include a link to a pre-filtered dashboard for faster triage.
Example alert notification
The following example shows a sample alert email generated by the monitor when an anomaly breaches the defined threshold. In this case, the monitor is tracking a high-cardinality detector and has triggered an alert for a specific entity (host = server_3):
Monitor **ad-monitor** entered **ALERT** state — please investigate.

Trigger    : ad-trigger
Severity   : 1
Time range : 2025-10-01T23:42:33.699Z → 2025-10-01T23:44:33.699Z UTC

Entity
  • host = server_3