Discover traces
Introduced 3.5
The Discover Traces page in OpenSearch Dashboards provides an enhanced way to explore and analyze trace data within the Observability plugin. This page extends the traditional Discover experience by offering specialized capabilities for working with trace data.
Prerequisites
Before using the Traces page, ensure that you have fulfilled the following prerequisites:
-
Enable feature flags: Add the following settings to your
opensearch_dashboards.ymlfile:workspace.enabled: true data_source.enabled: true explore.enabled: true explore.discoverTraces.enabled: trueAfter updating the configuration file, restart OpenSearch Dashboards for the changes to take effect.
-
Create an observability workspace: You must be working within an observability workspace. The Traces page is only available in this workspace type.
Note: Workspaces are not compatible with multi-tenancy. To enable workspaces, you must first disable multi-tenancy by setting
opensearch_security.multitenancy.enabled: false. -
Configure multiple data sources: You must have multiple data sources configured. For instructions, see Multiple data sources.
Accessing the Traces page
To access the Traces page:
- Navigate to an Observability workspace in OpenSearch Dashboards.
- In the left navigation, expand Discover and select Traces, as shown in the following image.
Configuring trace datasets
To configure trace datasets, use one of the following options.
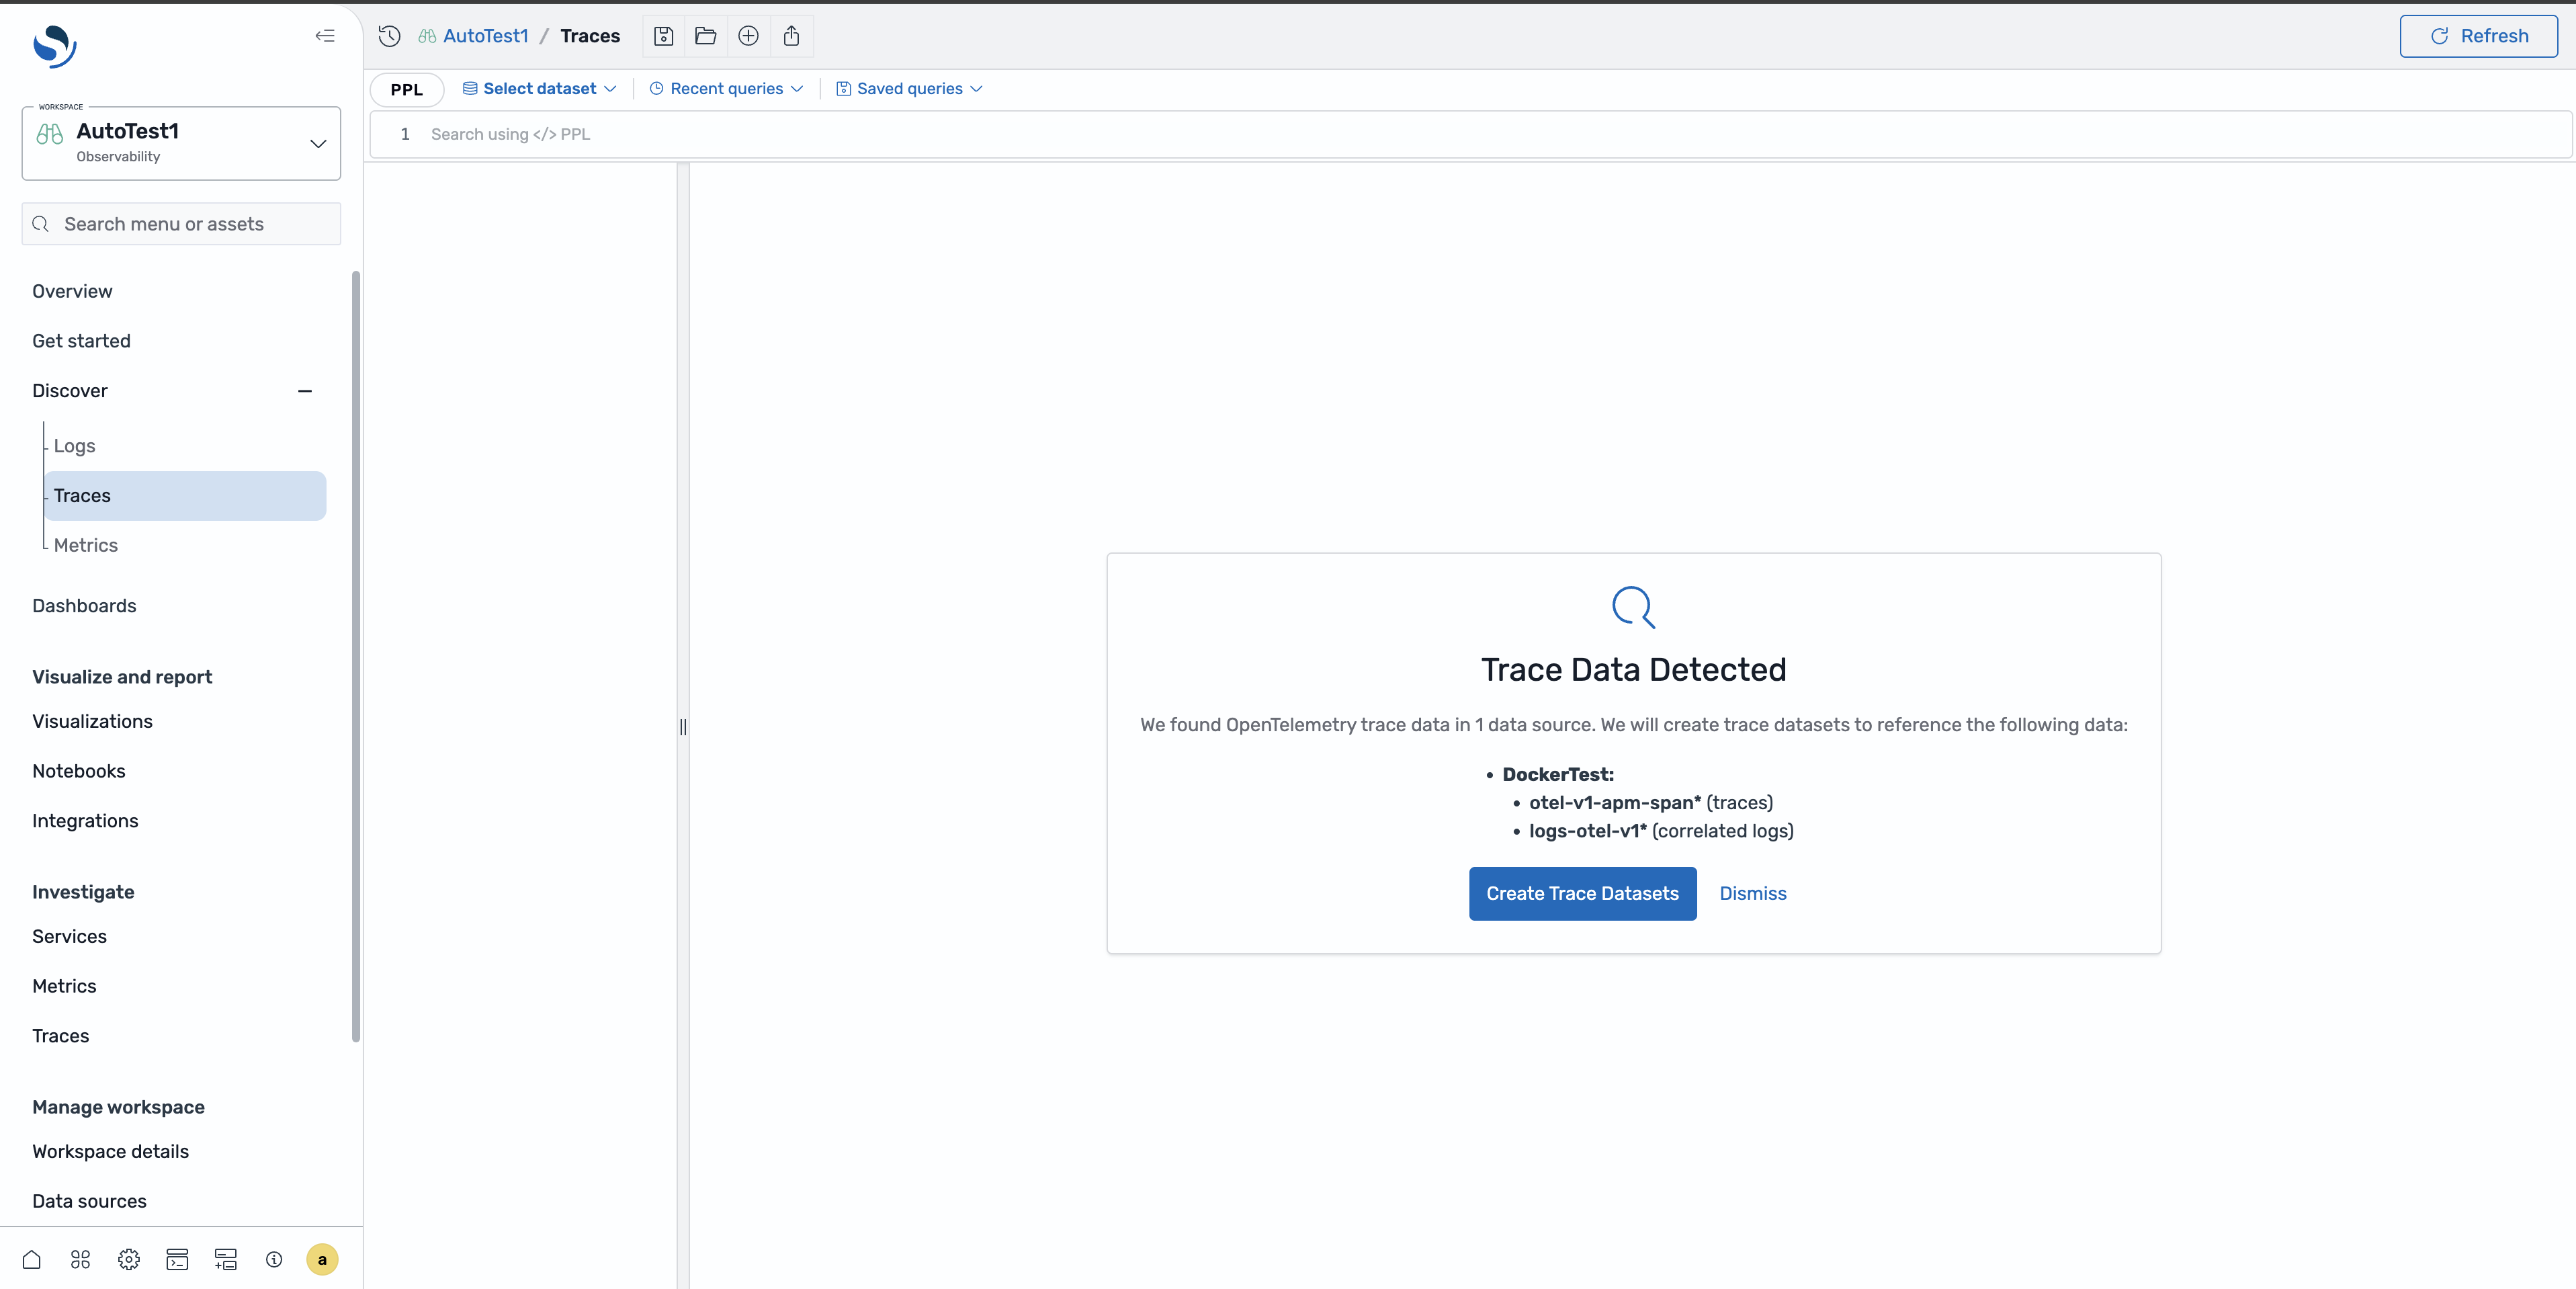
Automatic dataset creation
If your data source follows the OpenTelemetry naming conventions, the Traces page can automatically create trace and log datasets from your data by searching for indexes with the following naming patterns:
- Traces:
otel-v1-apm-span* - Correlated logs:
logs-otel-v1*
When these indexes are detected, select the Create Trace Datasets button, as shown in the following image, to automatically generate the datasets and establish the correlation relationship between traces and logs.
Manual dataset creation
If your indexes use different naming conventions, you must manually create the datasets and configure the correlation relationships between traces and logs. Navigate to the Datasets tab and create a dataset with the Trace signal type.
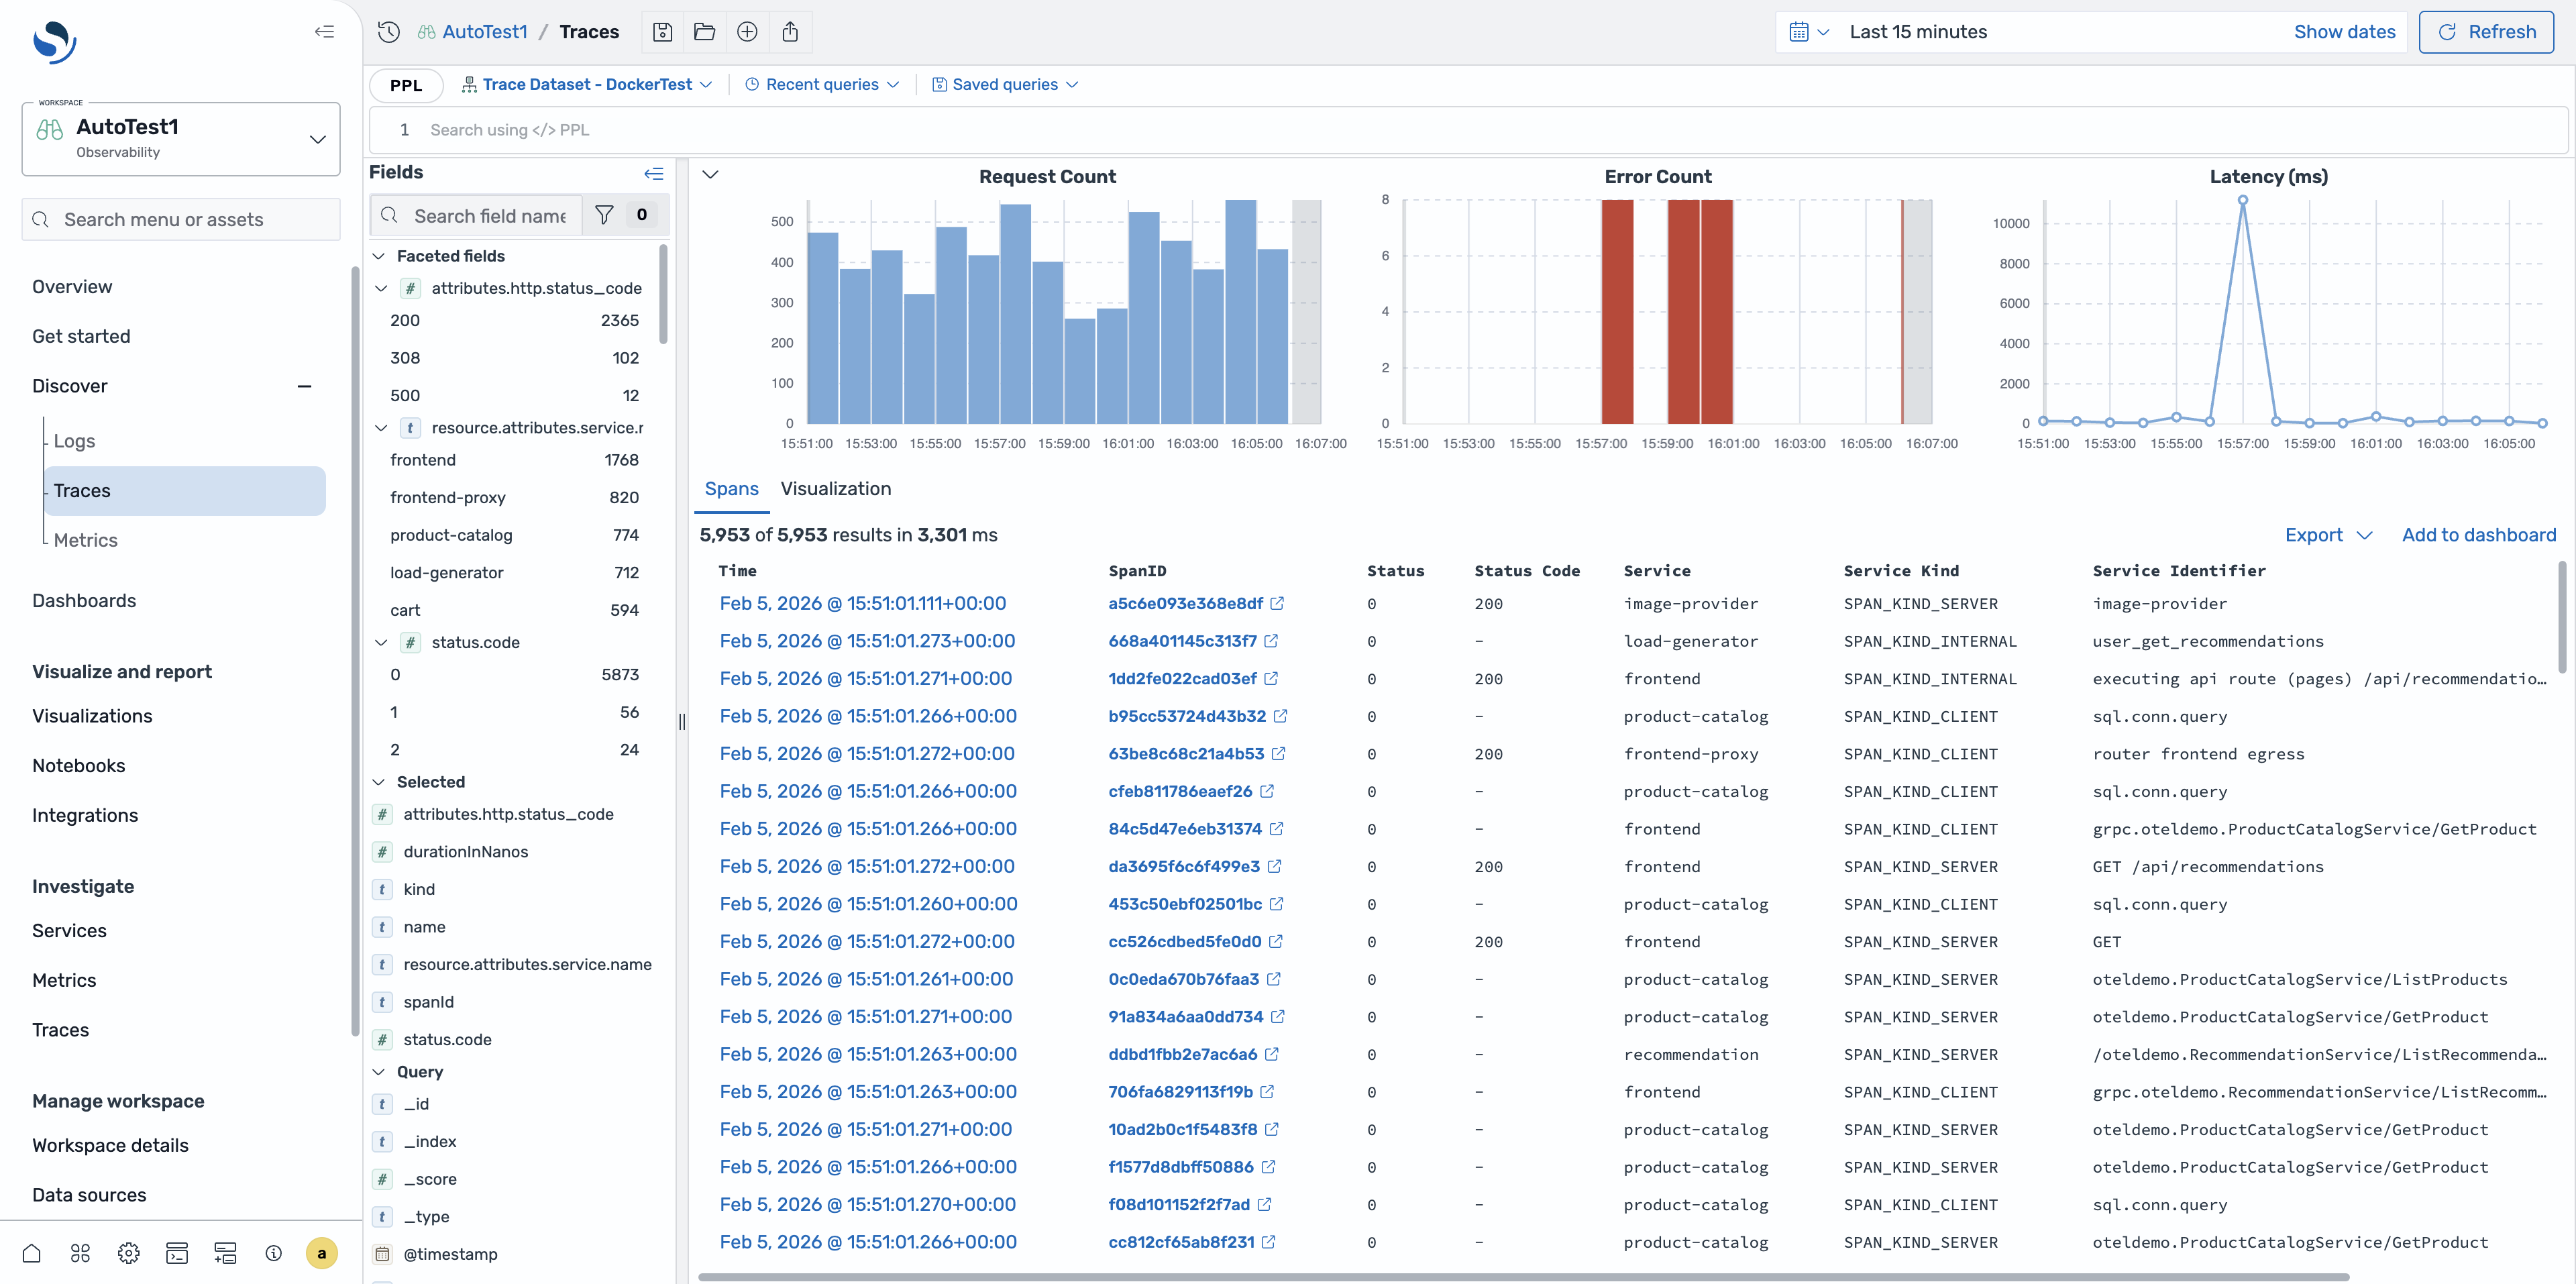
Exploring trace data
The Traces page provides comprehensive tools for analyzing span data and understanding trace performance, including:
- RED metrics: View rate, error, and duration metrics at the top of the page to quickly assess trace performance and health.
- Faceted fields: Use faceted field filters to filter and analyze specific aspects of your traces.
- Span table: Browse spans using sortable columns and quick access to detailed information.
Viewing a specific span
To view detailed information about a specific span, select the timestamp in the span table. This opens the Trace Details flyout, shown in the following image.
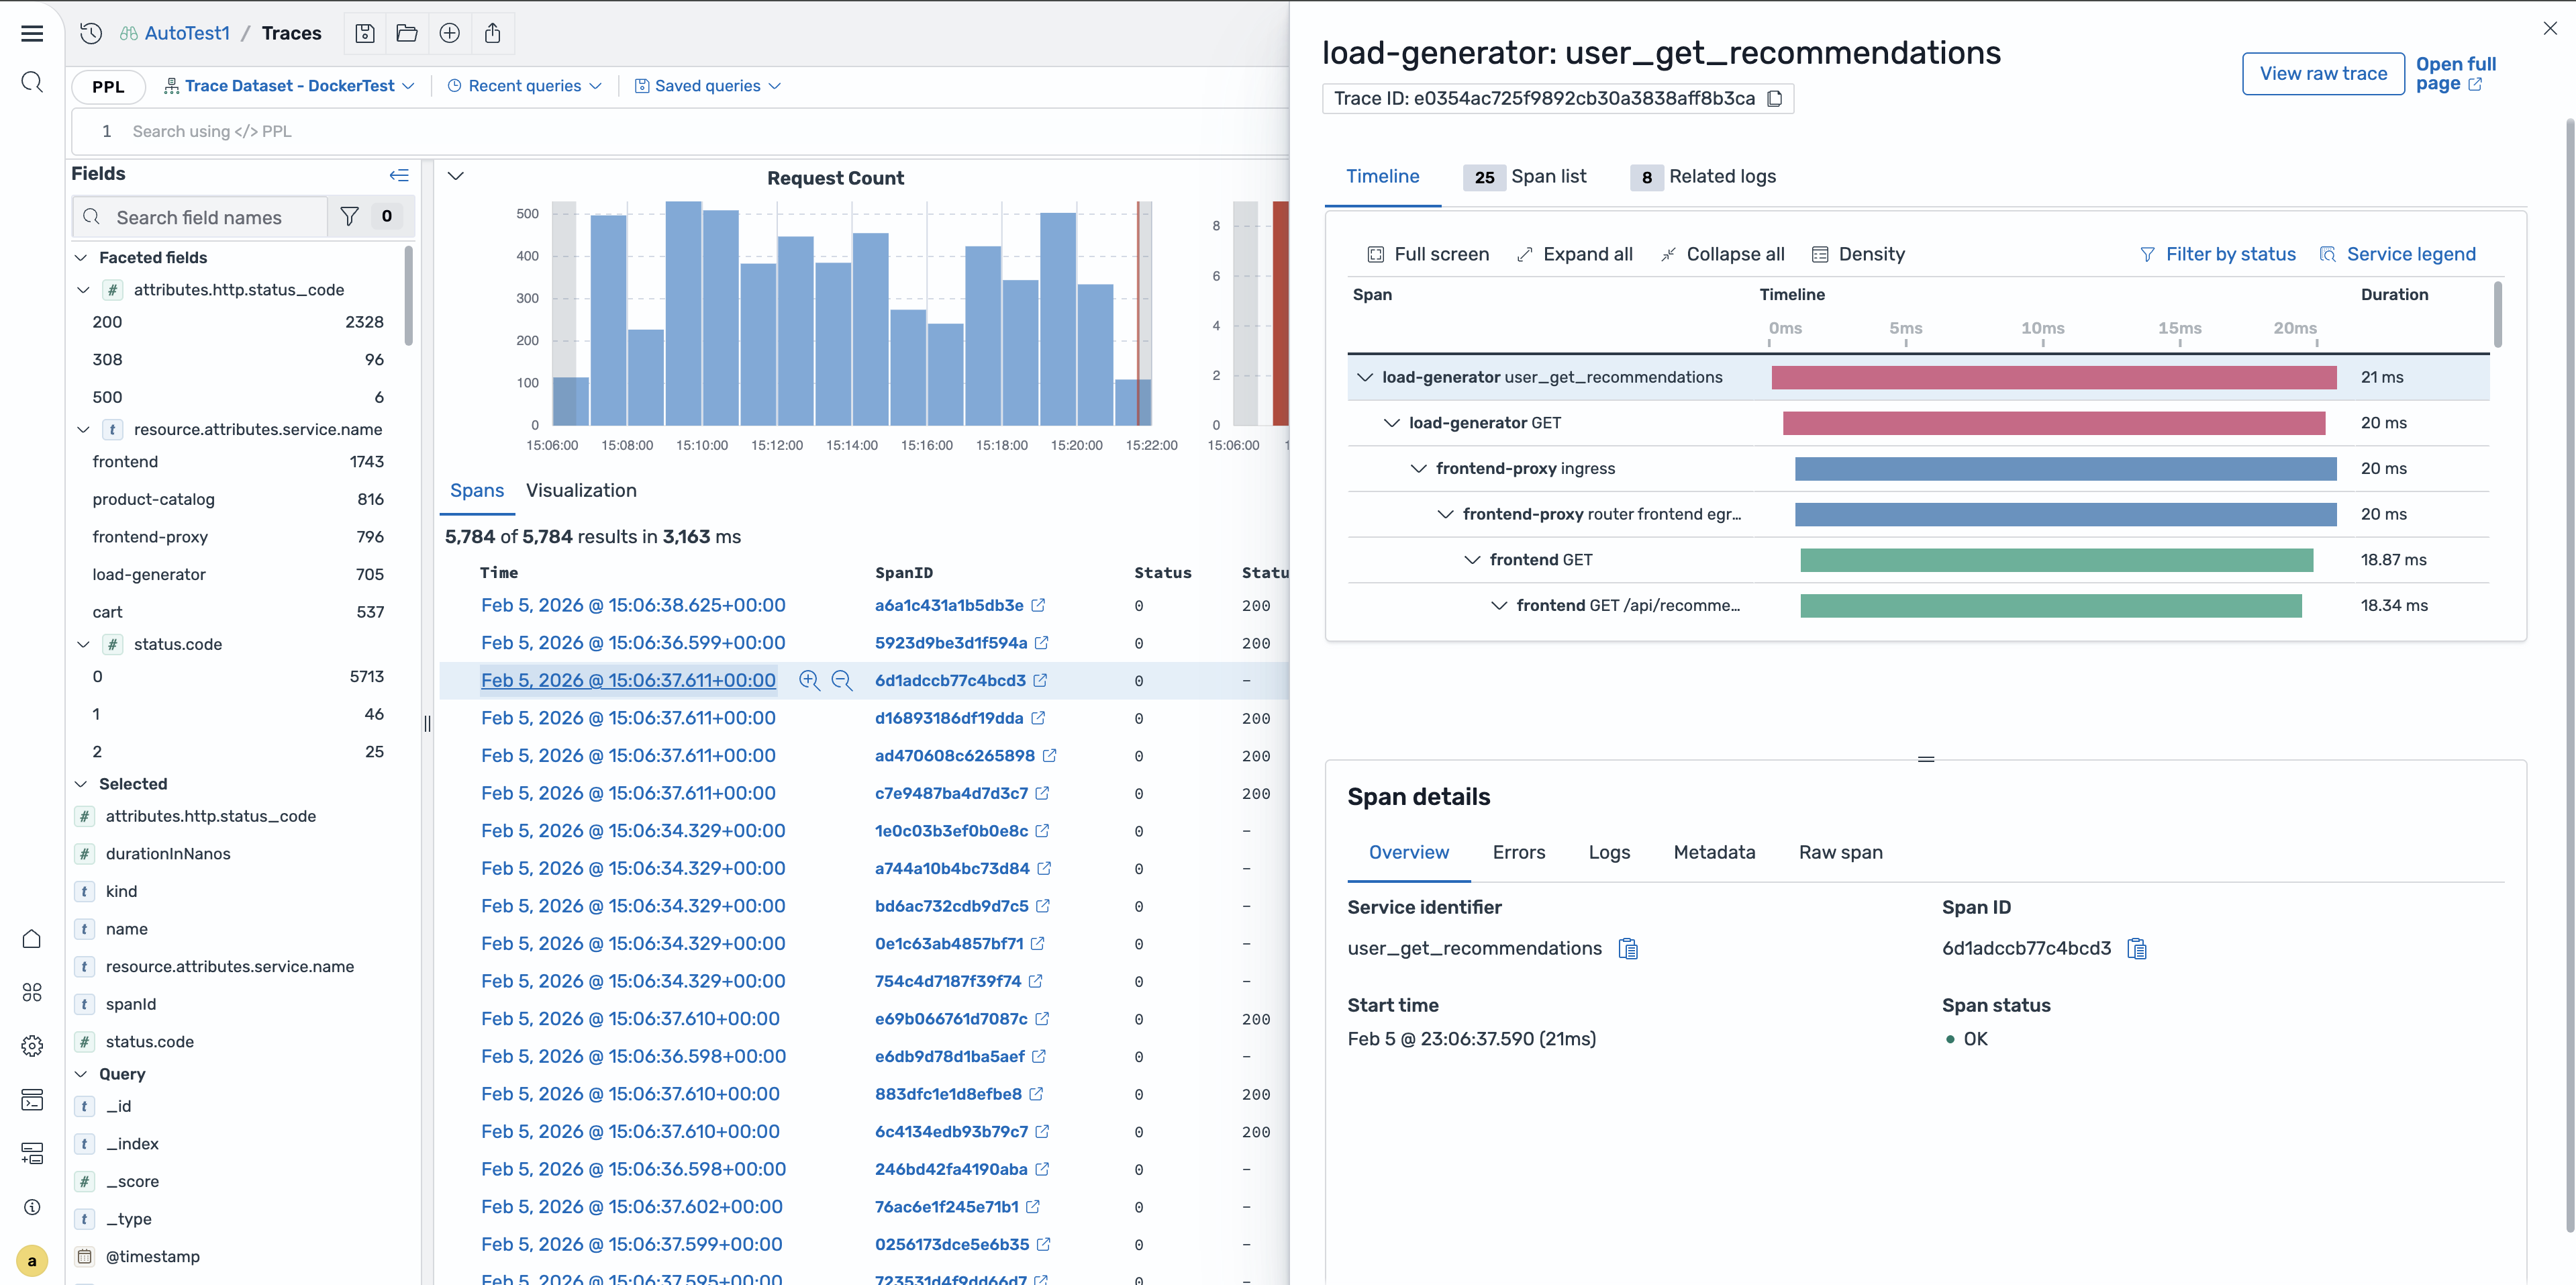
The Trace Details flyout displays the following information:
- The relationship of the selected span within its parent trace.
- The hierarchical structure showing how the span relates to other spans in the same trace.
- The span attributes and metadata.
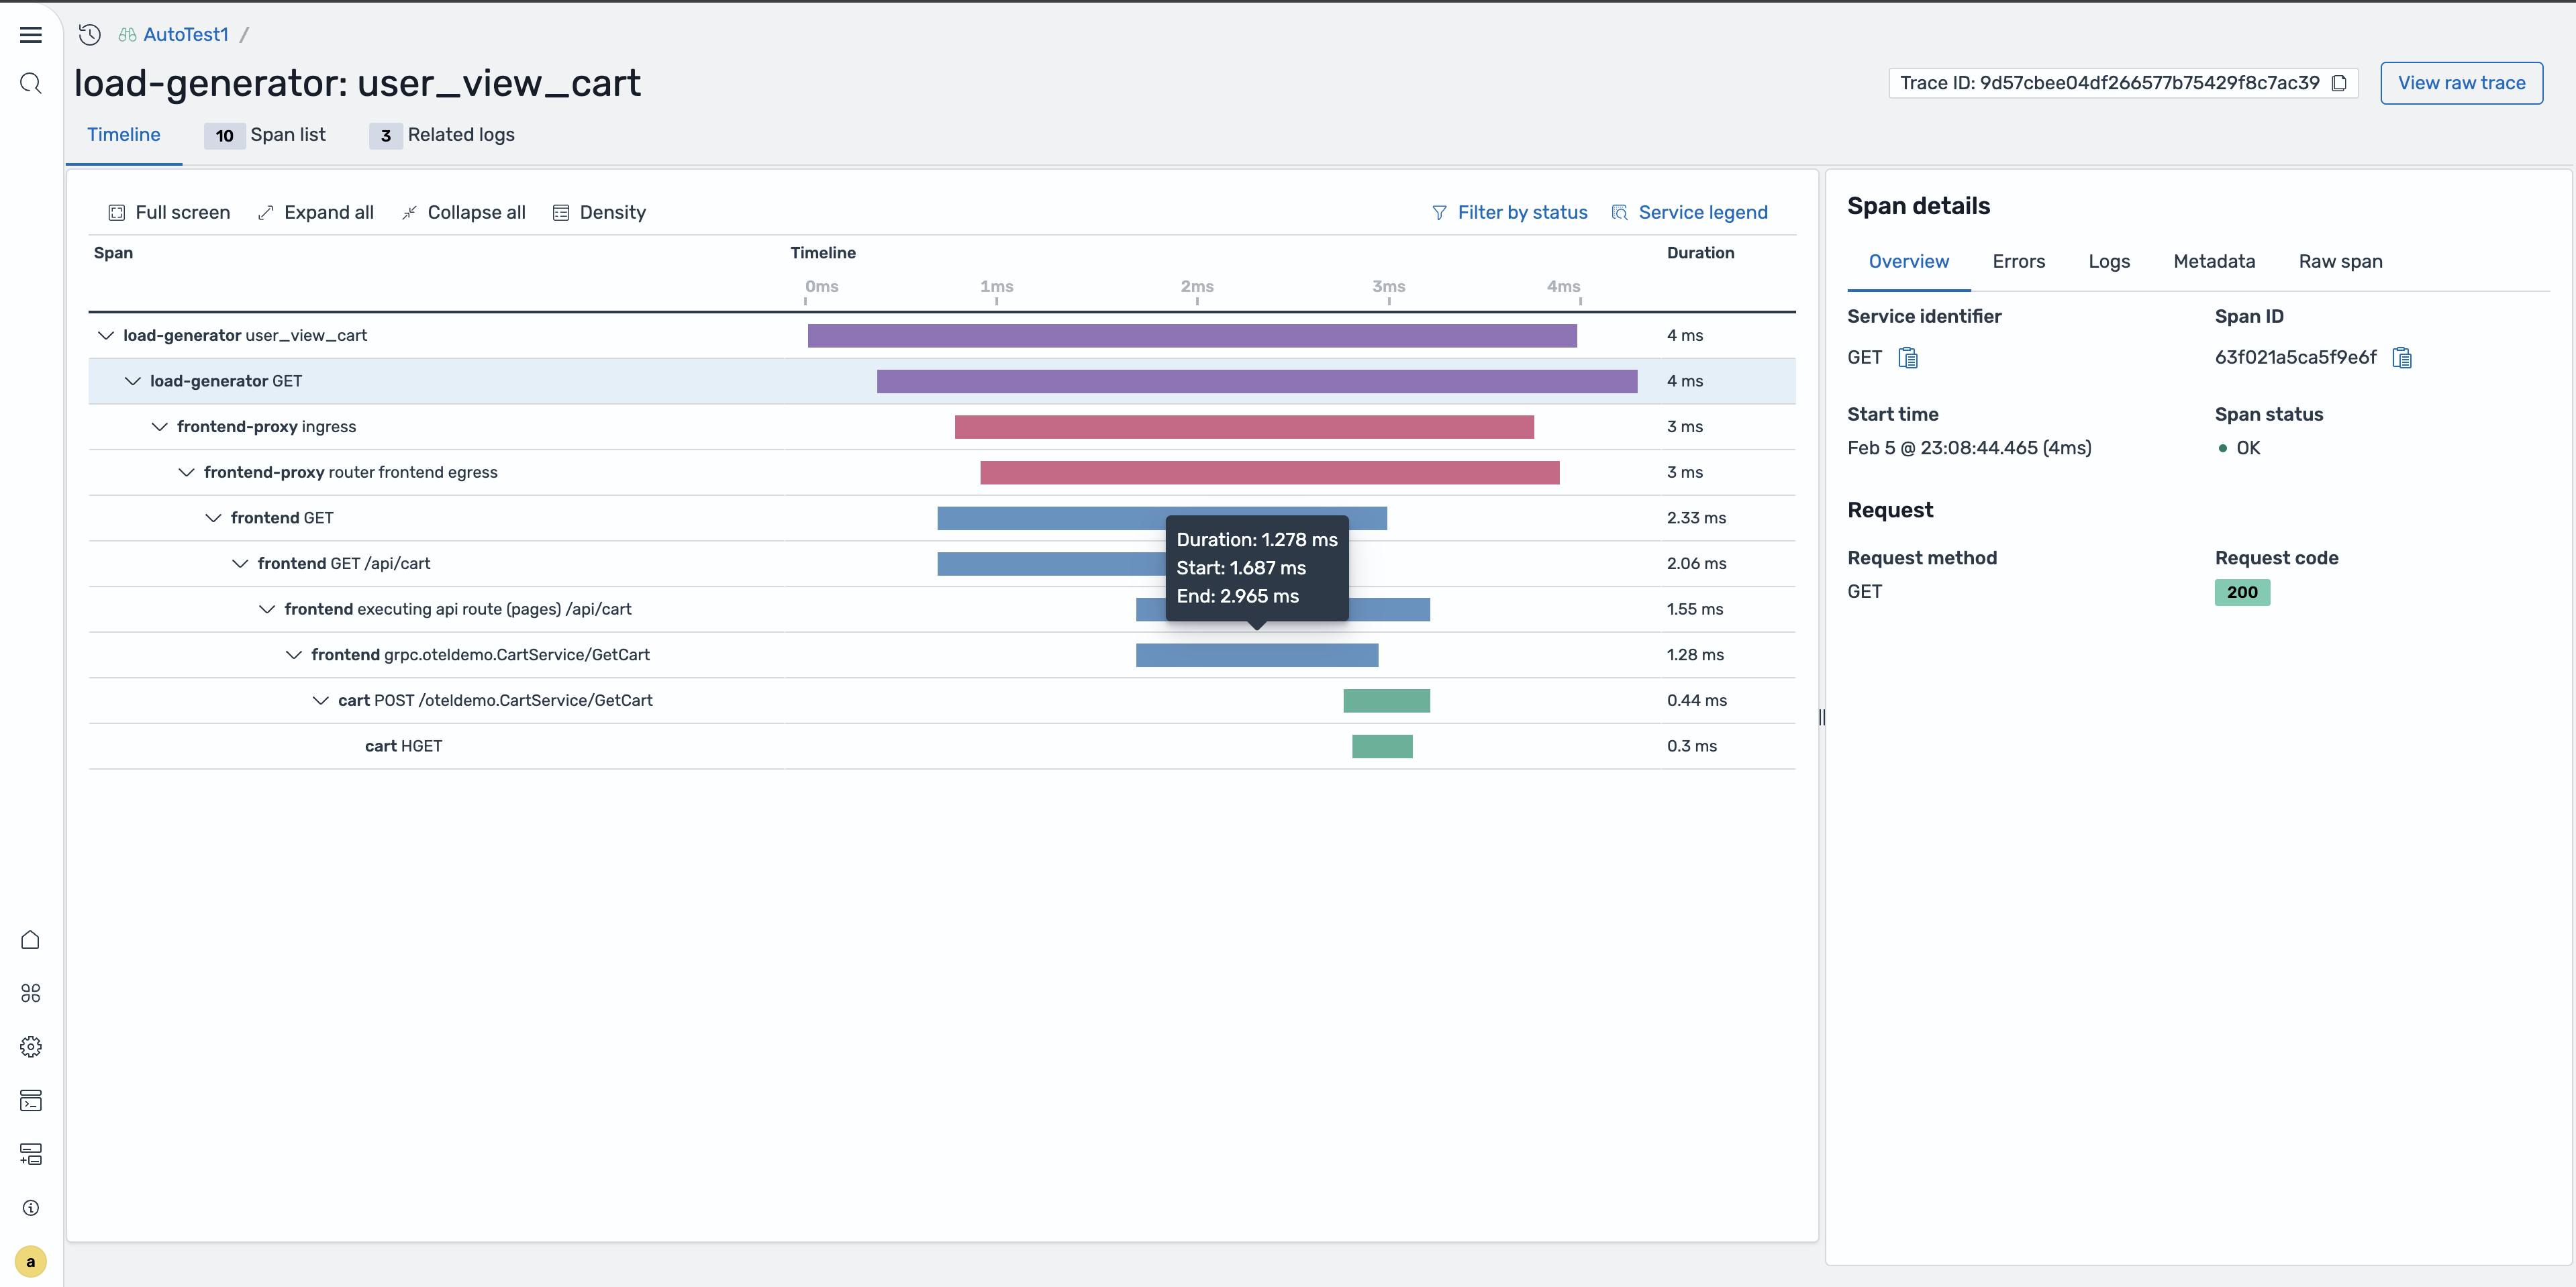
Trace detail page
To access the full trace detail page from the Trace Details flyout, use one of the following options:
- Select the span ID from the the Traces page table.
- Select Open full page from the flyout.
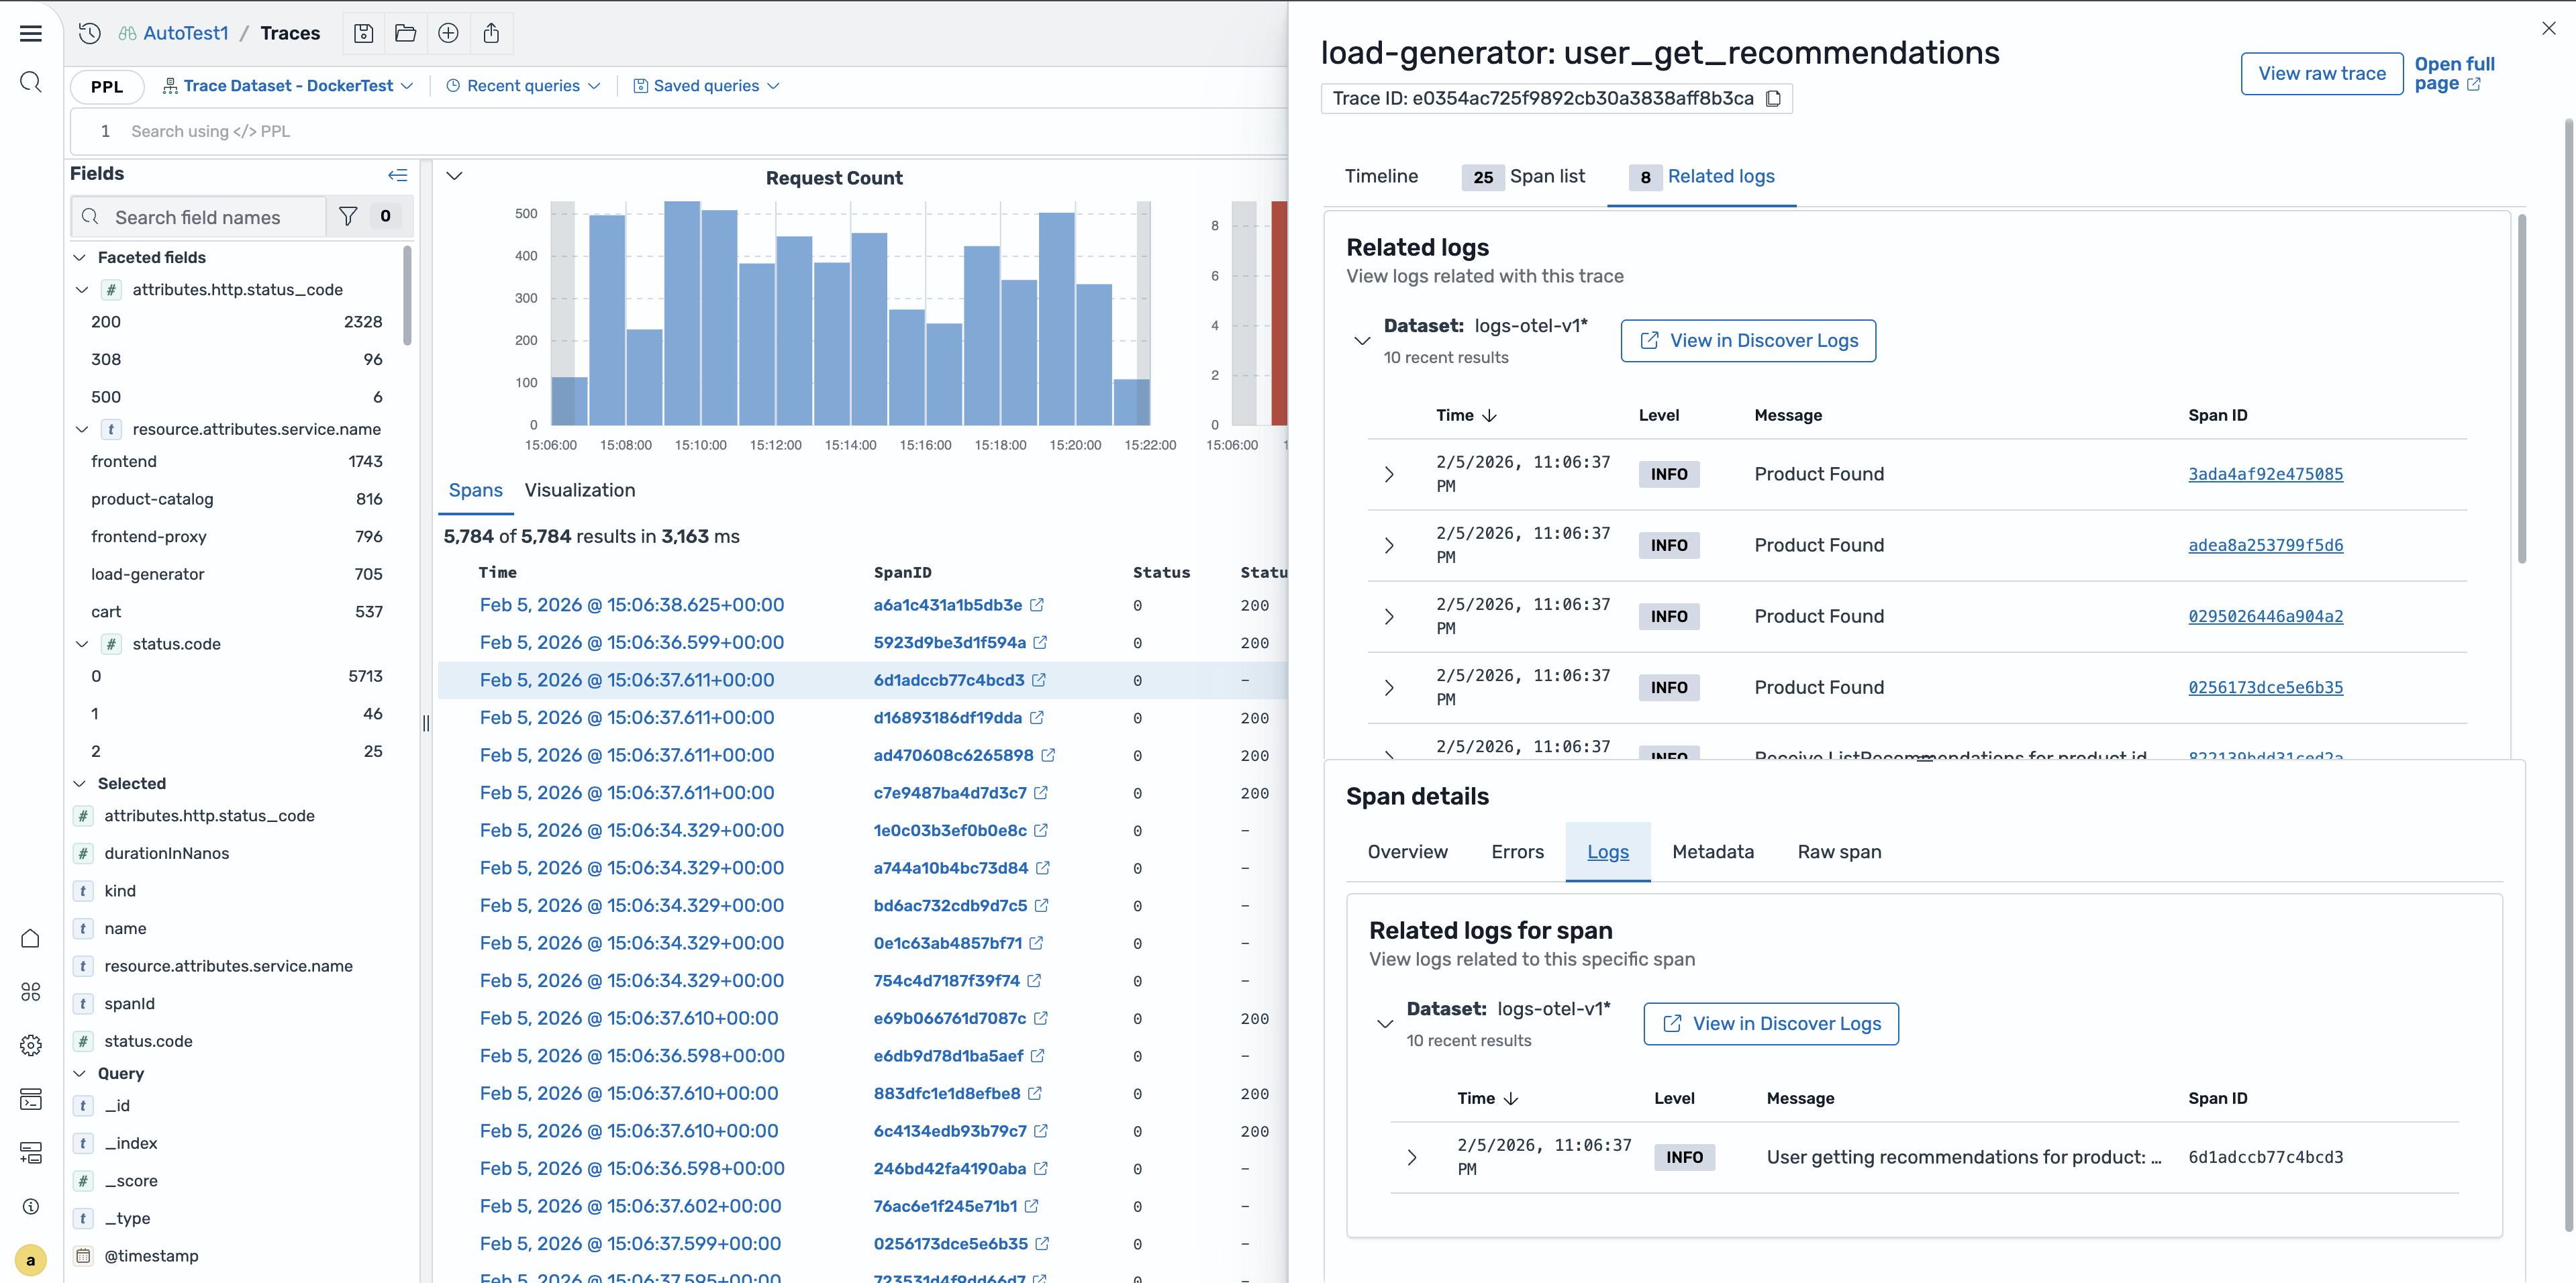
The full page view provides an expanded interface for deeper trace analysis, featuring a timeline visualization that shows the hierarchical span relationships and durations, along with detailed span information in a side panel, as shown in the following image.
Correlating traces with logs
The Traces page provides seamless integration with log data, allowing you to navigate from traces to related logs while preserving proper context.
Viewing related logs
To view the related logs, follow these steps:
- In the Trace Details flyout, locate the Related logs section.
- Select the View in Discover Logs button to navigate to the correlated log entries for the selected trace, as shown in the following image.
Log redirection with context
When you select View in Discover Logs, OpenSearch Dashboards automatically redirects you to the Logs page with the trace context applied, as shown in the following image.
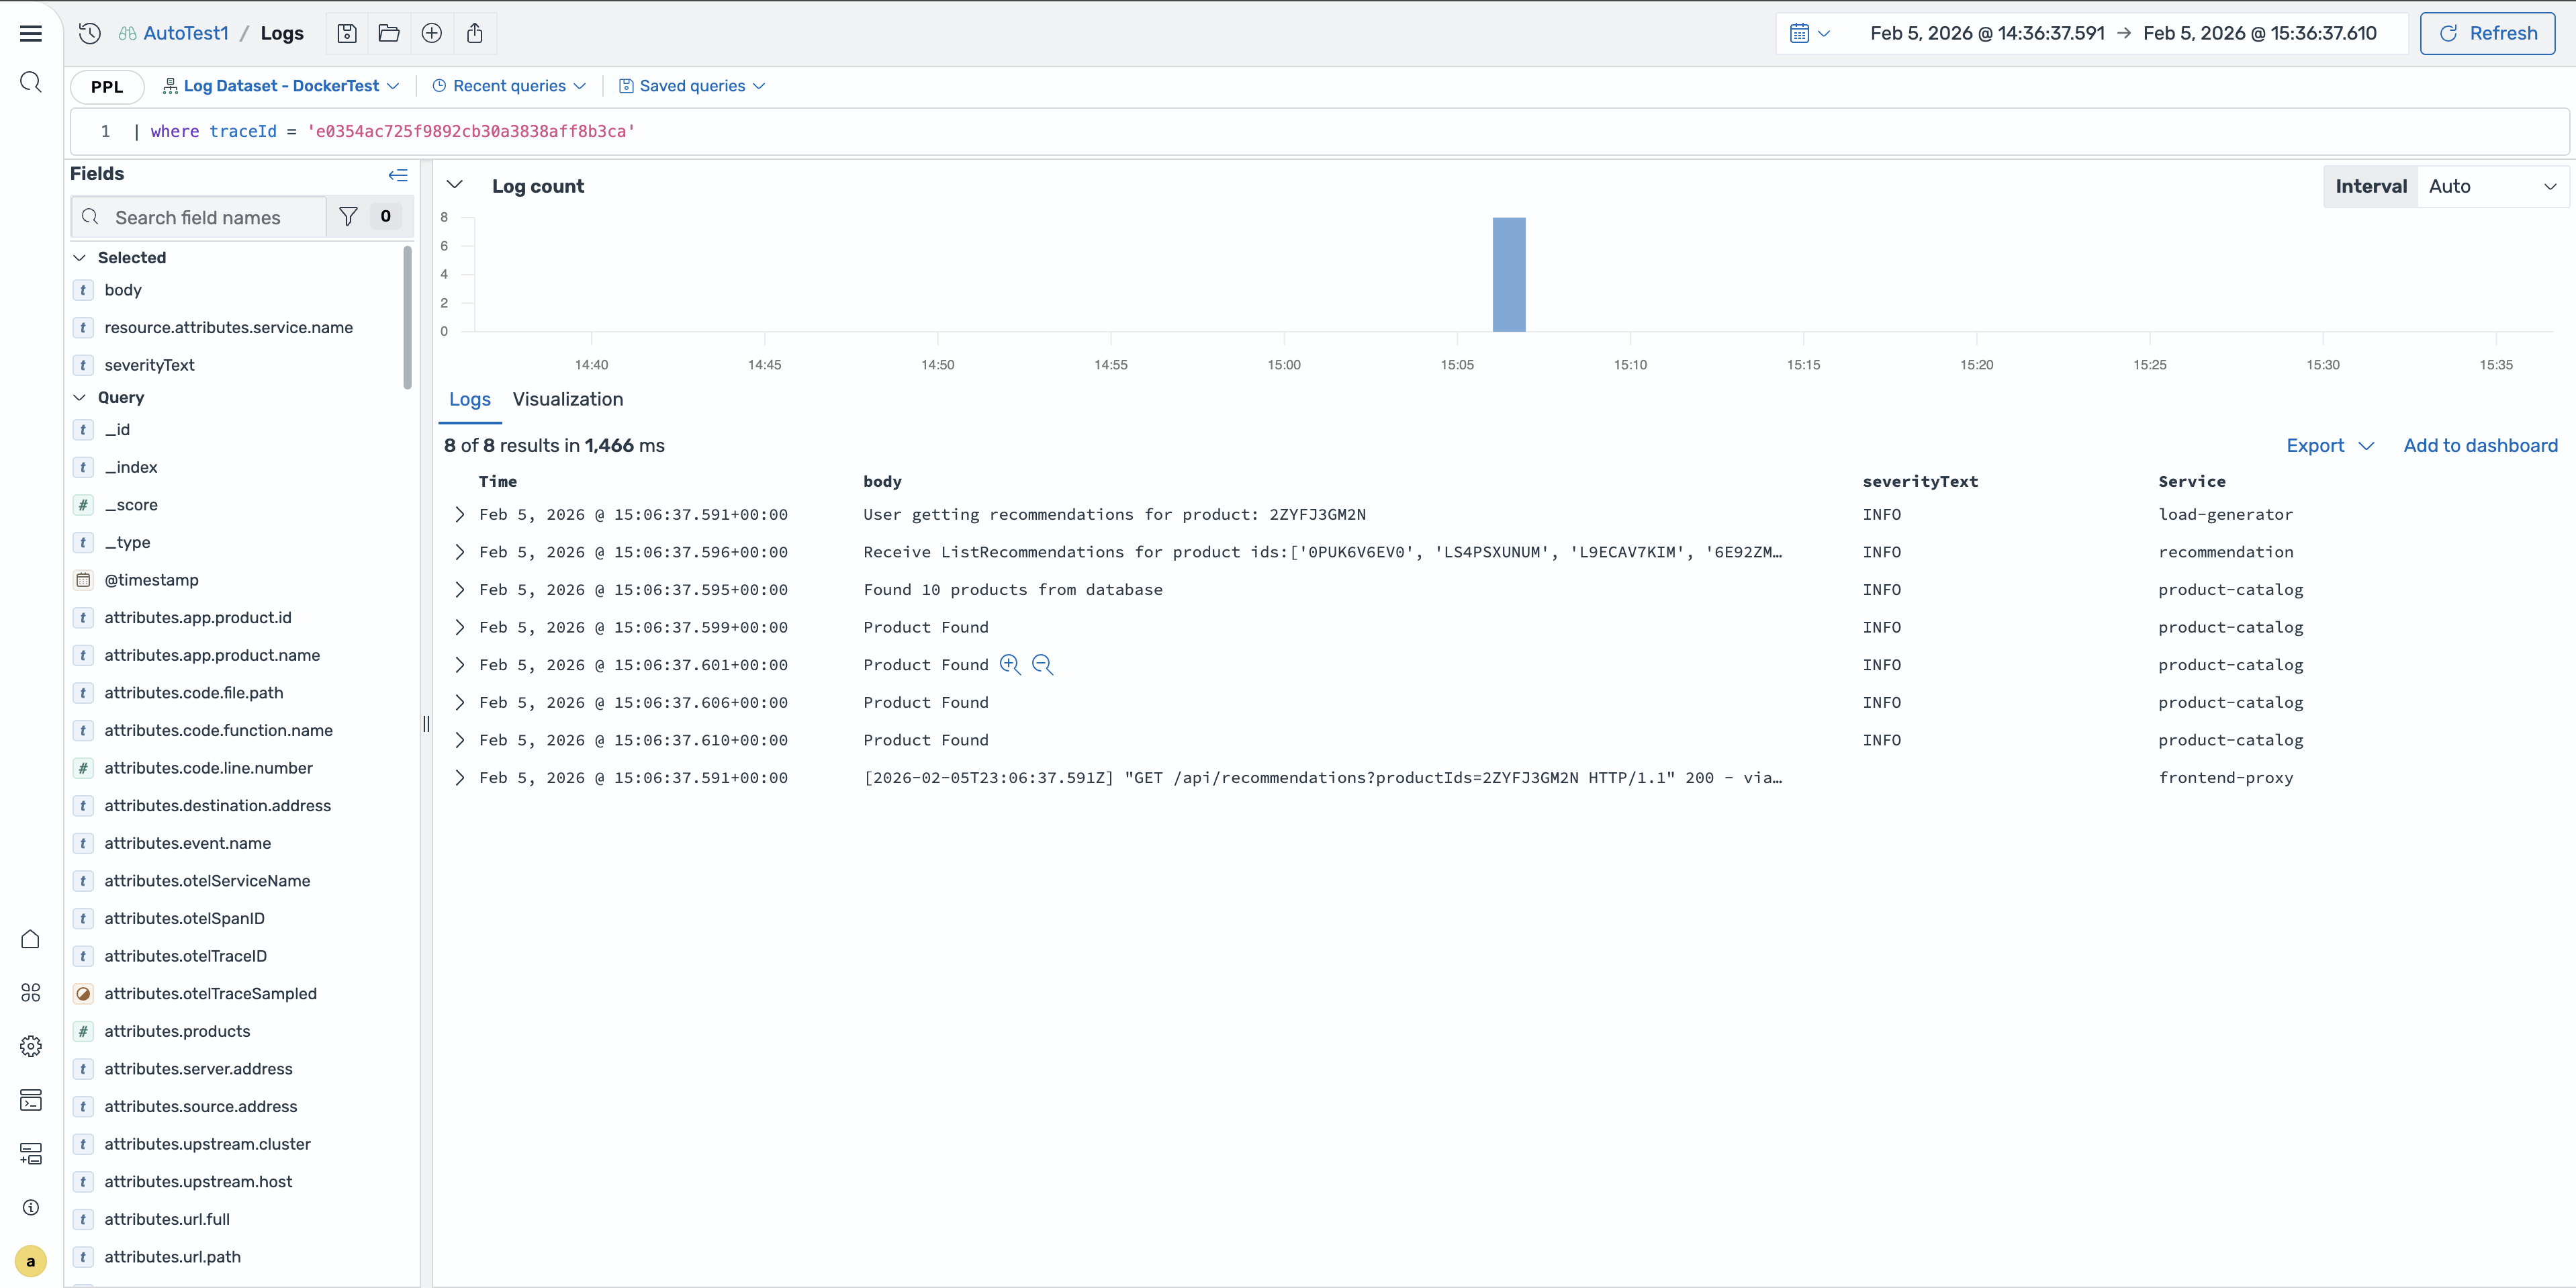
The logs are filtered to show only entries related to the selected trace, making it easier to troubleshoot issues and understand the full context of trace events. Preserving context streamlines the debugging process by providing a unified view of your telemetry data, helping you identify root causes and understand the complete picture of application behavior.