Viewing agent traces
Introduced 3.6
The Agent Traces page in OpenSearch Dashboards lets you explore, debug, and monitor large language model (LLM) agent execution traces. You can view traces in multiple synchronized visualizations, examine span details, and analyze metrics for your agentic AI applications.
Enabling agent traces
Agent traces functionality is included in default OpenSearch distributions. To enable agent traces, add the following feature flags to your opensearch_dashboards.yml configuration file:
workspace.enabled: true
data_source.enabled: true
explore.enabled: true
explore.agentTraces.enabled: true
After updating the configuration, restart OpenSearch Dashboards for the changes to take effect.
PPL query support is enabled by default in default OpenSearch distributions. If you’re running a minimal distribution of OpenSearch, install the SQL plugin before using agent traces.
Understanding traces and spans
In agent tracing, a trace represents a complete execution flow (such as a single agent invocation), while spans represent individual operations within that trace (such as LLM calls, tool executions, or retrieval operations). Each trace consists of one or more spans organized in a parent-child hierarchy.
Span categories
Agent traces classifies spans into categories based on the gen_ai.operation.name attribute. Each category has a distinct color and icon in the Agent Traces page.
| Category | Operation names | Description |
|---|---|---|
| Agent | invoke_agent, create_agent | Agent invocations and initialization. |
| LLM | chat, text_completion, generate_content | LLM chat completion, text completion, and content generation requests. |
| Tool | execute_tool | Tool and function calls. |
| Embeddings | embeddings | Embedding generation requests. |
| Retrieval | retrieval | Document or data retrieval operations. |
| Other | Unmapped operations | Operations not matching a known category. |
Span attributes
When you instrument your application using the opensearch-genai-observability-sdk-py SDK, spans are automatically created with the required attributes. The following tables list the core OpenTelemetry attributes and the generative AI semantic convention attributes.
Core attributes
The following table lists the core OpenTelemetry attributes.
| Attribute | Required | Description |
|---|---|---|
traceId | Yes | A unique identifier for the trace. |
spanId | Yes | A unique identifier for the span. |
parentSpanId | No | The identifier of the parent span. Empty for root spans. |
startTime | Yes | The span start timestamp. |
endTime | Yes | The span end timestamp. |
durationInNanos | Yes | The span duration, in nanoseconds. |
status.code | Yes | The span status code. Valid values are OK (success), ERROR (failure), or UNSET (default status when not explicitly set). |
Generative AI attributes
The following table lists the generative AI semantic convention attributes.
| Attribute | Required | Description |
|---|---|---|
gen_ai.operation.name | Yes | The operation type. Valid values are chat, invoke_agent, execute_tool, create_agent, text_completion, embeddings, or retrieval. Used for span categorization, filtering, and tab queries. |
gen_ai.provider.name | Yes | The generative AI provider name (for example, openai, anthropic). |
gen_ai.agent.name | Optional | A human-readable name of the GenAI agent. |
gen_ai.request.model | Optional | The model name to which the request is sent. |
gen_ai.usage.input_tokens | Optional | The number of input tokens consumed. |
gen_ai.usage.output_tokens | Optional | The number of output tokens generated. |
gen_ai.input.messages | Optional | The chat history or prompt provided as model input. |
gen_ai.output.messages | Optional | The messages or completion returned by the model. |
gen_ai.tool.name | Optional | The name of the tool used by the agent. Only applicable to execute_tool operation spans. |
gen_ai.tool.call.id | Optional | The tool call identifier. Only applicable to execute_tool operation spans. |
Data pipeline
Agent traces follow this data pipeline:
- Instrumented LLM applications send OpenTelemetry Protocol (OTLP) data over gRPC or HTTP.
- The OpenTelemetry Collector processes and routes the data.
- Data Prepper ingests the data into OpenSearch using the
otel_trace_rawprocessor. - OpenSearch stores trace data in
otel-v1-apm-span-*indexes. - OpenSearch Dashboards displays the traces in the Agent Traces page.
Using the interface
To access agent traces in OpenSearch Dashboards, choose Observability from the main menu, then choose Agent Traces.
The Agent Traces page includes the following components.
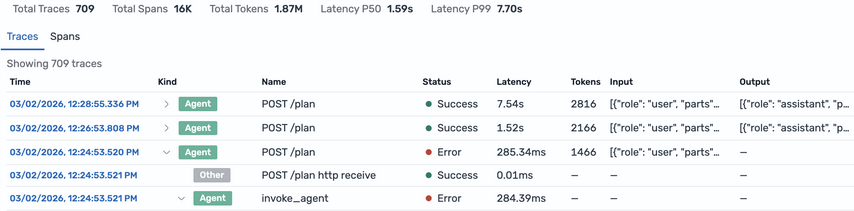
Traces tab
The Traces tab displays root-level traces in a paginated table. You can expand a row to view child spans inline.
The following image shows the Traces tab.
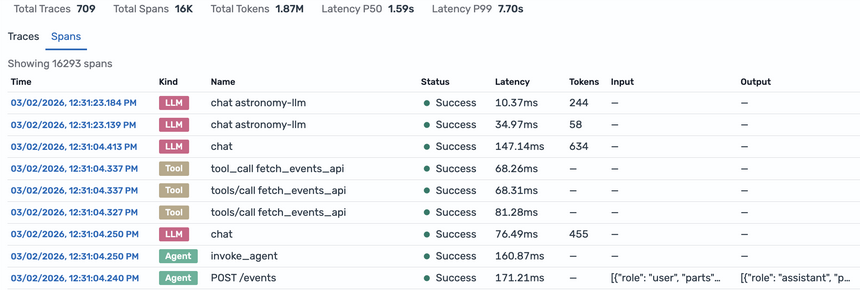
Spans tab
The Spans tab shows all generative AI spans, not only root traces. Use this tab to examine individual operations across multiple traces. The table includes the same columns as the Traces tab.
The following image shows the Spans tab.
Trace details
Select a row in the Traces or Spans tab to open the trace details. Trace details provide three synchronized visualization views and a span details panel. Selecting a span in any view highlights it across all three views.
Agent graph
The agent graph renders traces as a directed acyclic graph (DAG) using the Dagre layout algorithm. Parent spans flow downward to child spans, and sibling spans are arranged horizontally.
The following image shows the agent graph view.
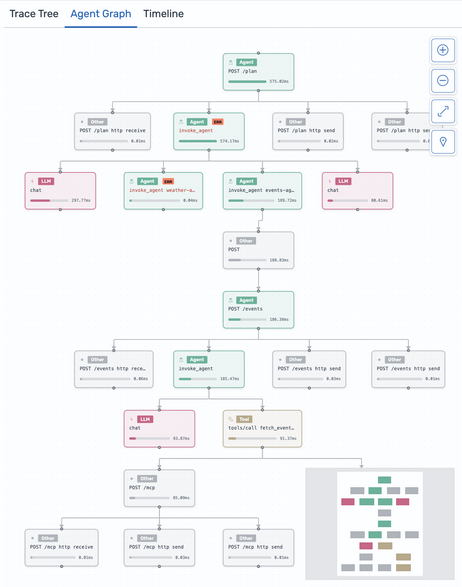
Each node in the graph includes the following elements:
- A color-coded badge indicating the span category (for example, Agent, LLM, or Tool).
- The span name, truncated to 37 characters.
- A bar showing the span duration as a percentage of total trace time.
- A red badge displayed for spans with an
ERRORstatus.
The Agent Graph provides the following controls:
- Adjust zoom from 0.1x to 2x.
- Reset the viewport to display all nodes.
Select a node to view its details in the span details panel. Select the background to deselect the node.
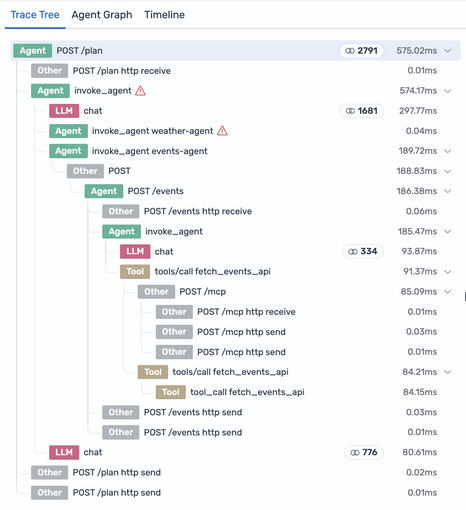
Trace tree view
The trace tree view displays all spans in an expandable hierarchical structure. Each row shows the following information:
- The color-coded span category.
- The operation name.
- The number of tokens consumed by the operation.
- The span duration.
Expand or collapse nodes to navigate the parent-child relationships.
The following image shows the trace tree view.
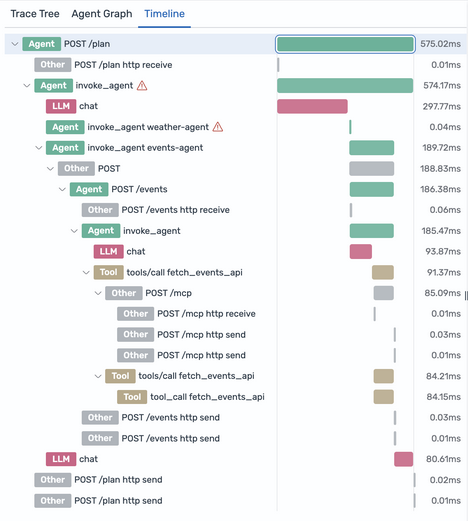
Timeline view
The timeline view presents a Gantt-style chart showing span durations chronologically. Each span appears as a horizontal bar with the following characteristics:
- The bar width corresponds to the span duration.
- The bar color matches the span category color.
- The indentation reflects the span hierarchy depth.
Overlapping bars indicate concurrent operations. Use this view to identify bottlenecks and understand the sequential and parallel execution patterns of your agent.
The following image shows the timeline view.
Span details panel
The right panel displays detailed information about the selected span, including all JSON attributes and execution timing.