Application performance monitoring
Introduced 3.6
Application Performance Monitoring (APM) provides real-time monitoring of your distributed applications by combining service topology data with Rate, Errors, Duration (RED) metrics. APM provides a unified view of service health, enabling you to quickly identify performance bottlenecks and failures across your microservices architecture.
APM architecture
The following image shows the APM architecture.
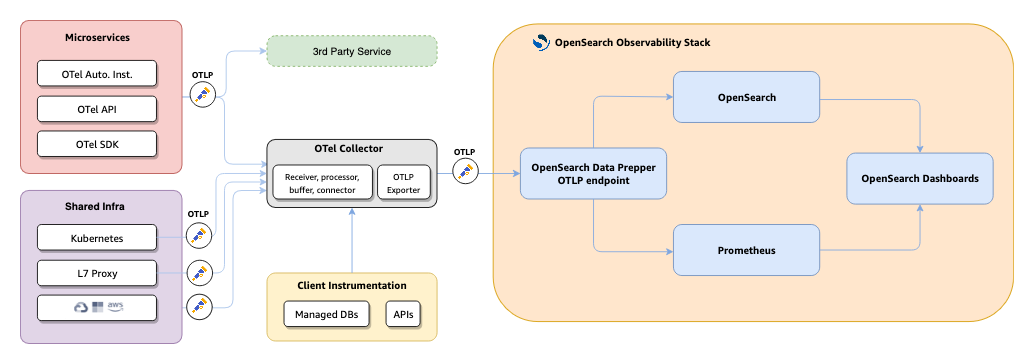
APM uses the following data pipeline to collect, process, and visualize application telemetry:
- OpenTelemetry SDKs instrument your application code to generate traces, logs, and metrics.
- OpenTelemetry Collector receives telemetry through OTLP (gRPC on port 4317 or HTTP on port 4318), processes it, and routes it to Data Prepper and Prometheus.
- OpenSearch Data Prepper processes traces and generates service maps and RED metrics using the
otel_apm_service_mapprocessor. - OpenSearch stores trace data, logs, and service topology information.
- Prometheus stores time-series RED metrics through remote write.
- OpenSearch Dashboards provides the APM user interface for visualization and analysis.
Configuring APM
To configure APM, complete the following steps:
-
Create an observability workspace: APM features are only available within Observability workspaces. To learn how to enable and create workspaces, see Workspace for OpenSearch Dashboards.
-
Enable feature flags: Add the following settings to your
opensearch_dashboards.ymlfile:workspace.enabled: true data_source.enabled: true explore.enabled: true explore.discoverTraces.enabled: true explore.discoverMetrics.enabled: true -
Instrument your application: Integrate OpenTelemetry SDKs into your application code to generate trace and log data.
-
Configure telemetry ingestion: Set up the OpenTelemetry Collector and Data Prepper to process and route telemetry to OpenSearch and Prometheus. See Configuring telemetry ingestion.
-
Configure APM in OpenSearch Dashboards: Create datasets, index patterns, and connect data sources in your Observability workspace. See Configuring APM in OpenSearch Dashboards.
Using APM
After completing the setup steps, use the following APM pages to monitor your services:
- Services: View a centralized catalog of all instrumented services with key performance indicators, per-operation metrics, and dependency information.
- Application map: Explore an interactive topology visualization autogenerated from trace data, with RED metrics overlaid on each service node.
APM is distinct from the older Application analytics and Trace analytics features. APM provides a more integrated experience that combines service topology, RED metrics, and in-context correlations into a single workflow.
Next steps
- Configuring telemetry ingestion: Set up the OpenTelemetry Collector and Data Prepper to process and route telemetry to OpenSearch and Prometheus.