Services
Introduced 3.6
The Services page provides a centralized catalog of all instrumented services in your application, displaying Rate, Errors, Duration (RED) at a glance. Use this page to identify services with high error rates, latency issues, or throughput anomalies.
Accessing the Services page
To access the Services page, navigate to your Observability workspace and select APM > Services from the left navigation menu. The following image shows the Services page.
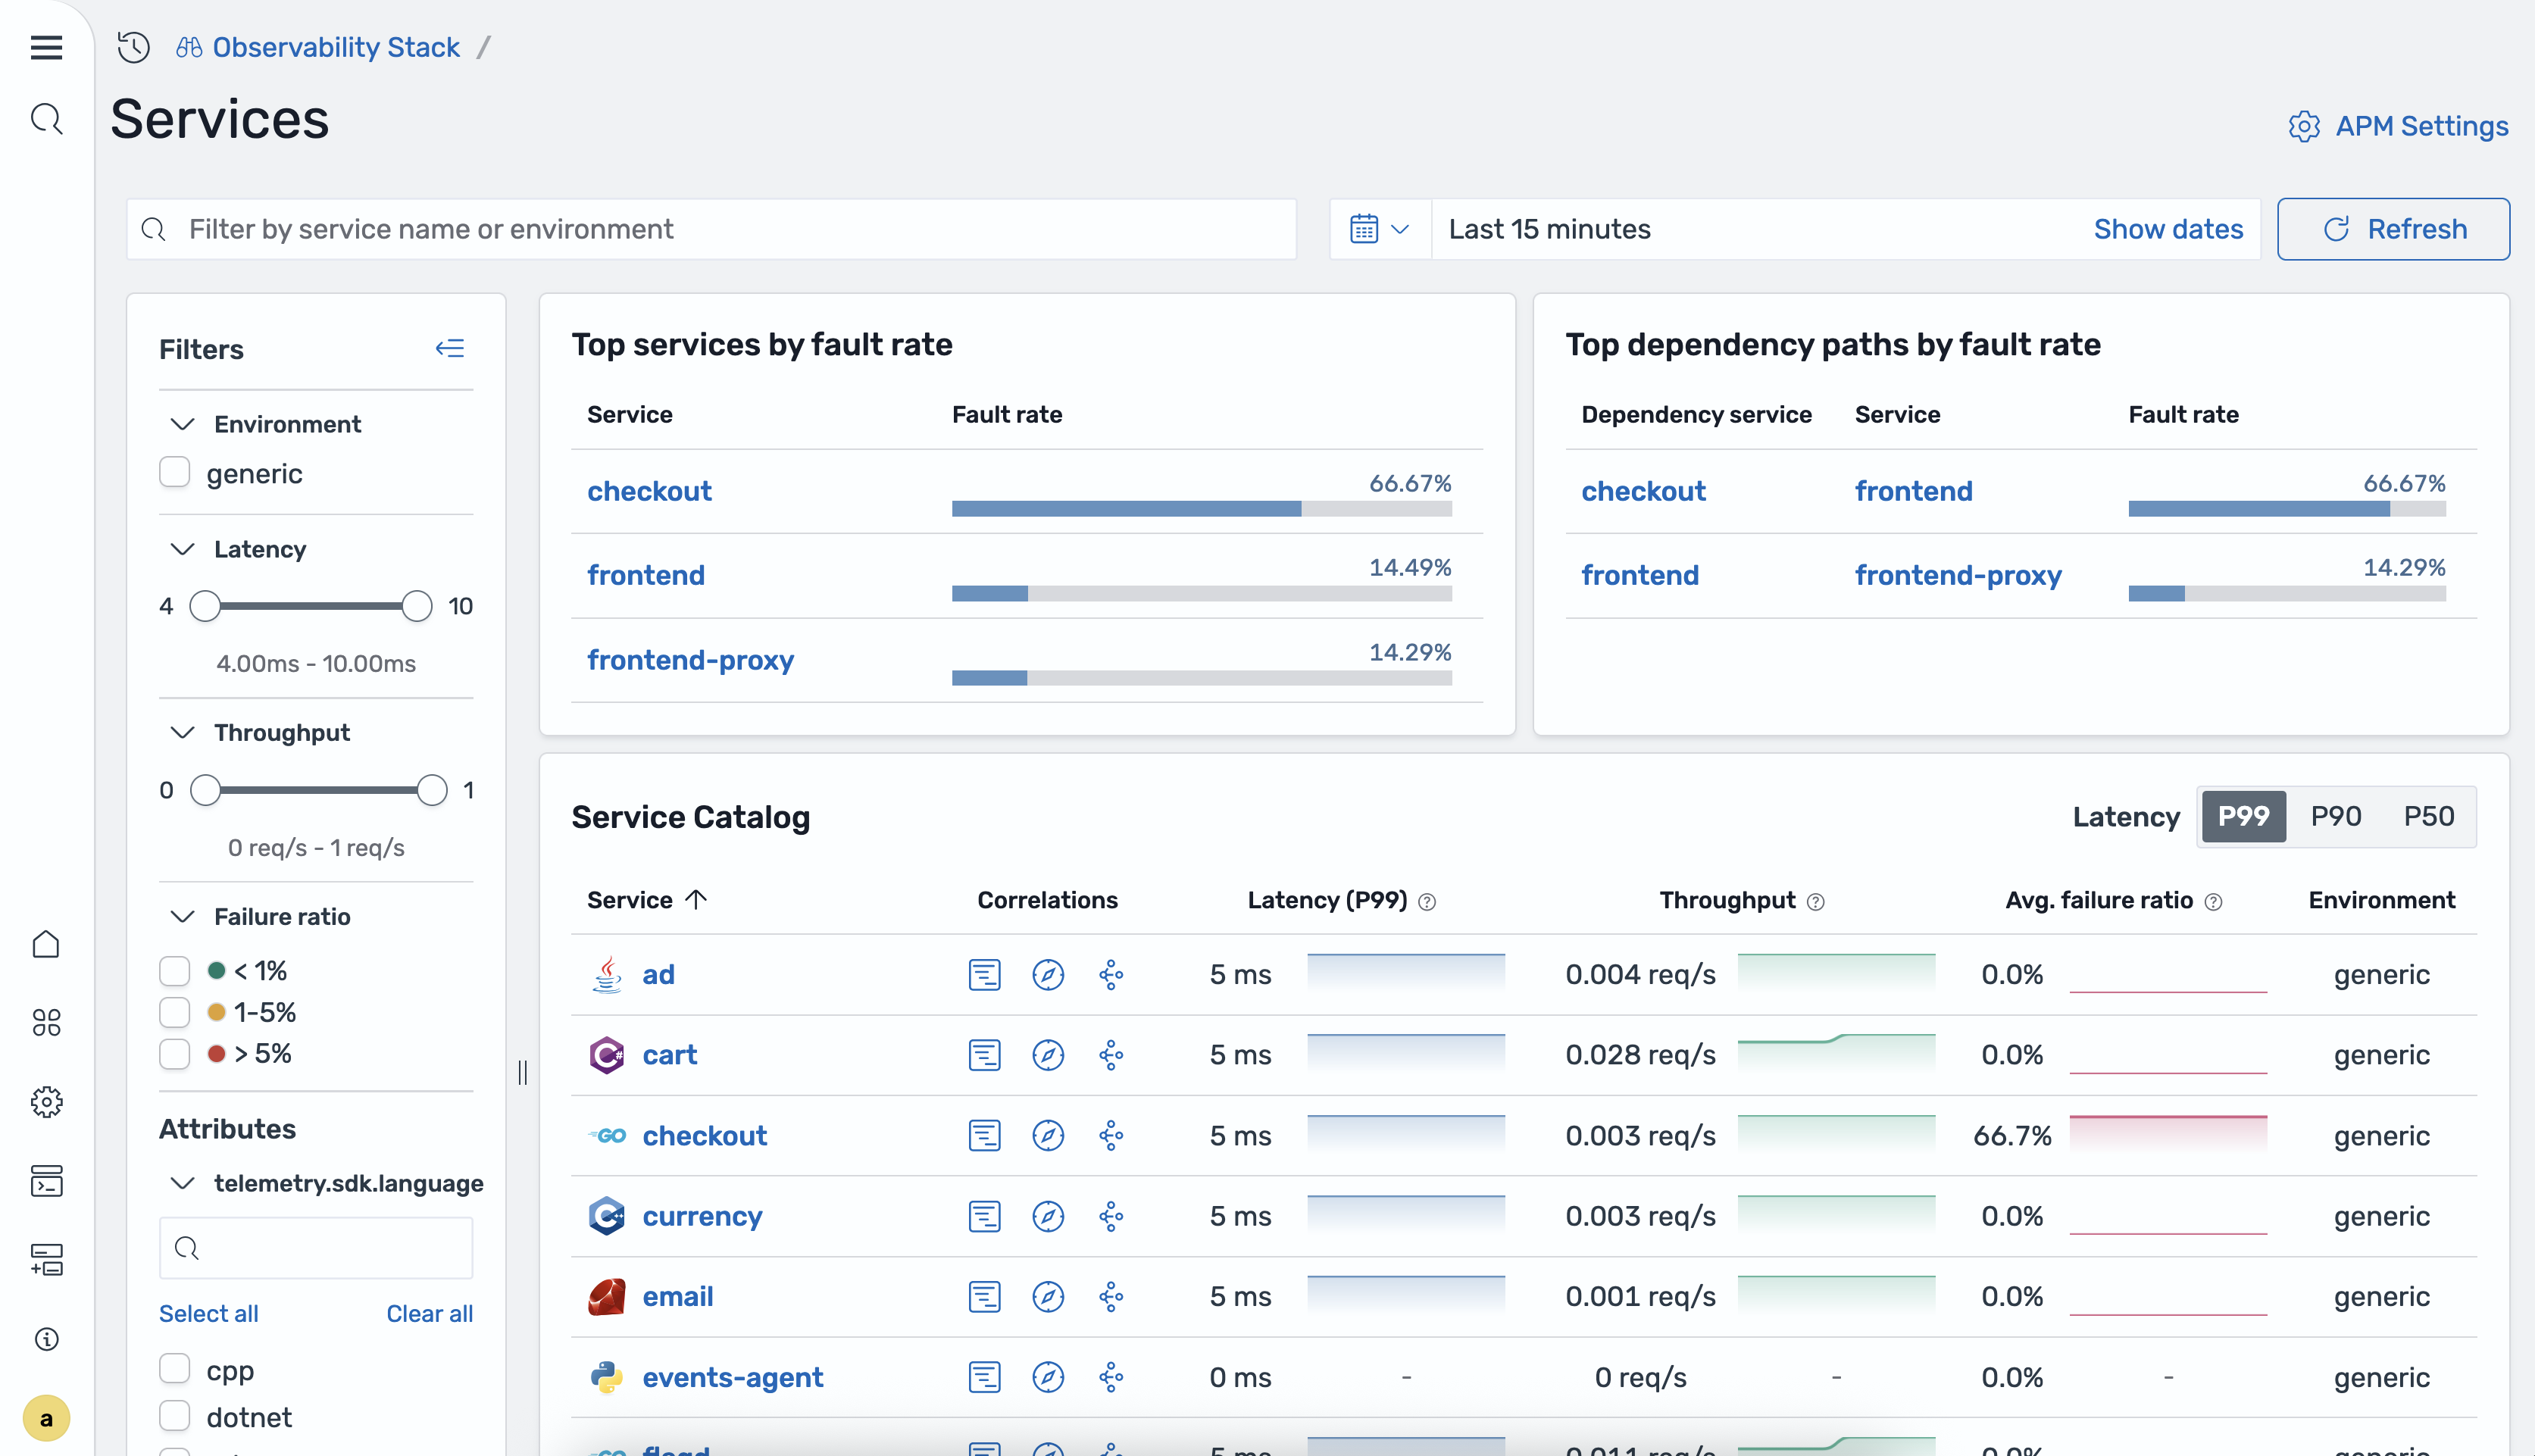
The Services home page displays a table of all discovered services with the following information:
- Service name: The name of the instrumented service as reported by the OpenTelemetry SDK.
- P99/P90/P50 latency: The 99th, 90th, and 50th percentile response times for the service.
- Total requests: The total number of requests handled by the service during the selected time range.
- Failure ratio: The percentage of requests resulting in errors (
4xxand5xxresponses). - Environment: The deployment environment (for example,
productionorstaging).
The Services home page also provides information about the Top services by fault rate and Top dependency paths by fault rate, helping you quickly identify critical issues and problematic service-to-service communication paths.
Service overview
Select a service name to open the service detail view. The following image shows a service overview.
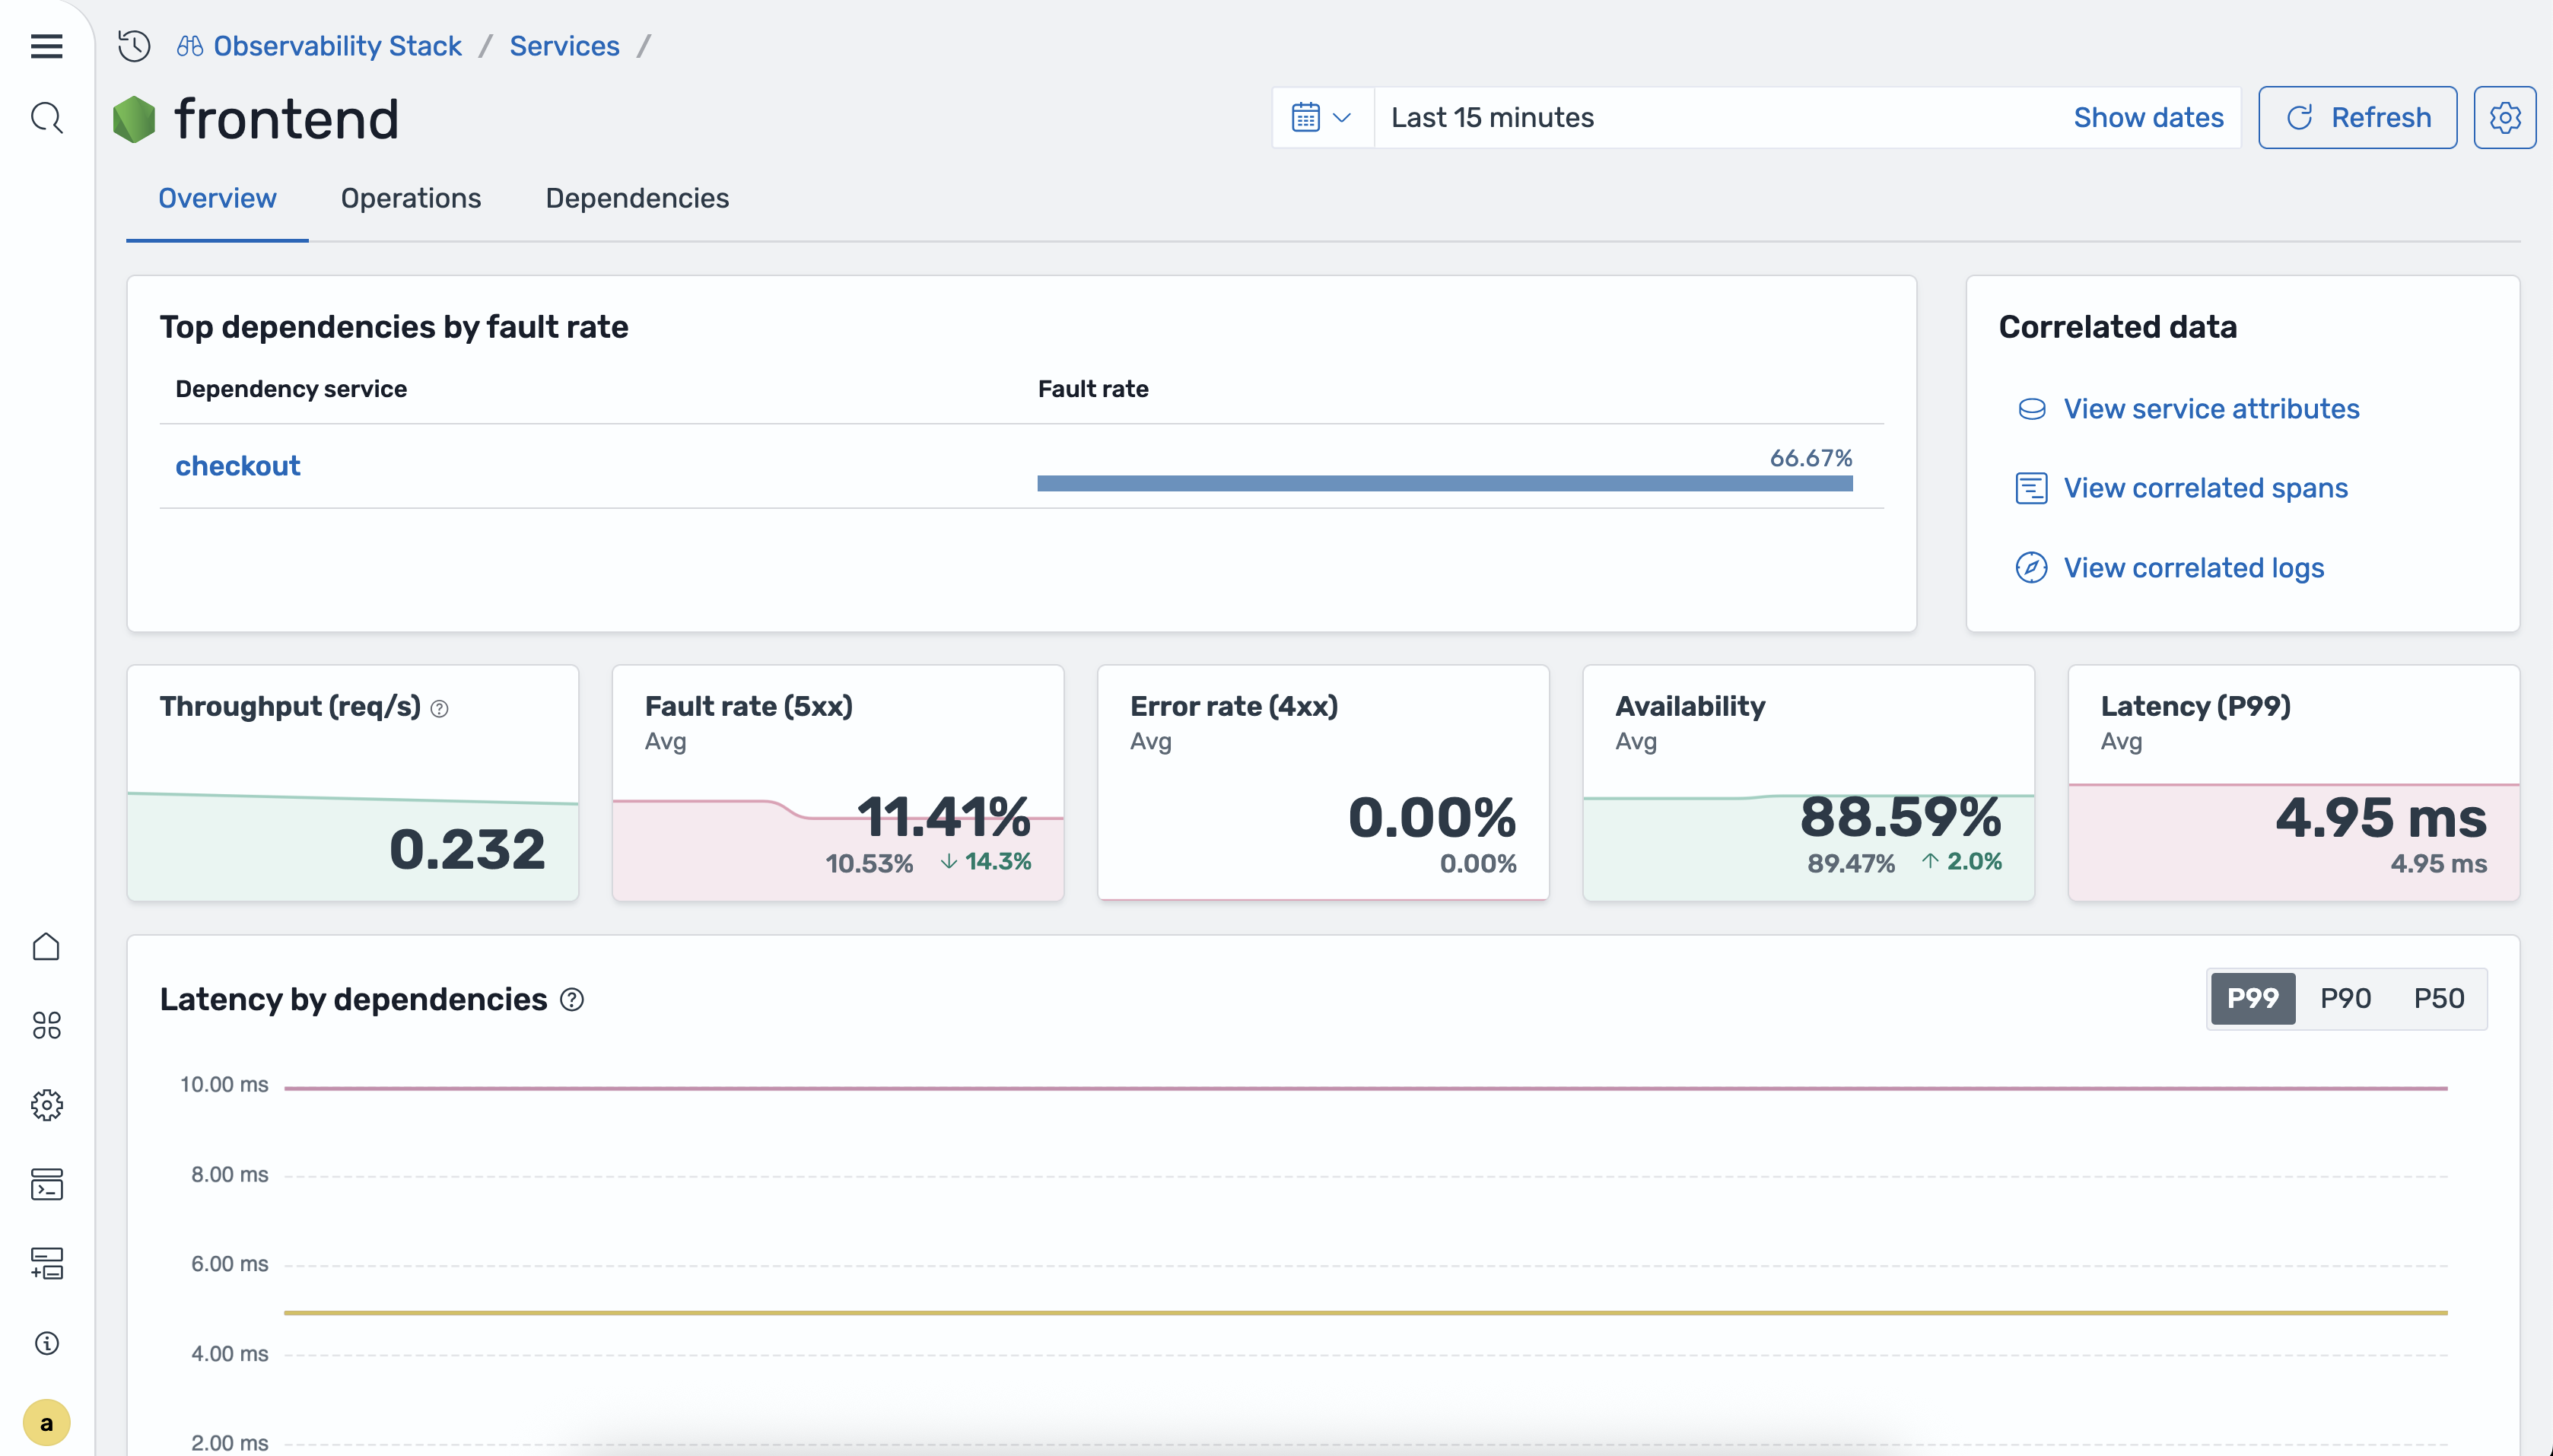
The Overview tab displays metric tiles summarizing the service’s current health, along with the following time-series charts:
- Latency by service dependencies: P50, P90, and P99 latency broken down by downstream dependencies.
- Requests by operations: Request volume per operation over time.
- Availability by operations: Availability percentage per operation over time.
- Fault rate and error rate by operations:
5xxfault rate and4xxerror rate per operation over time.
Operations
The following image shows the Operations tab.
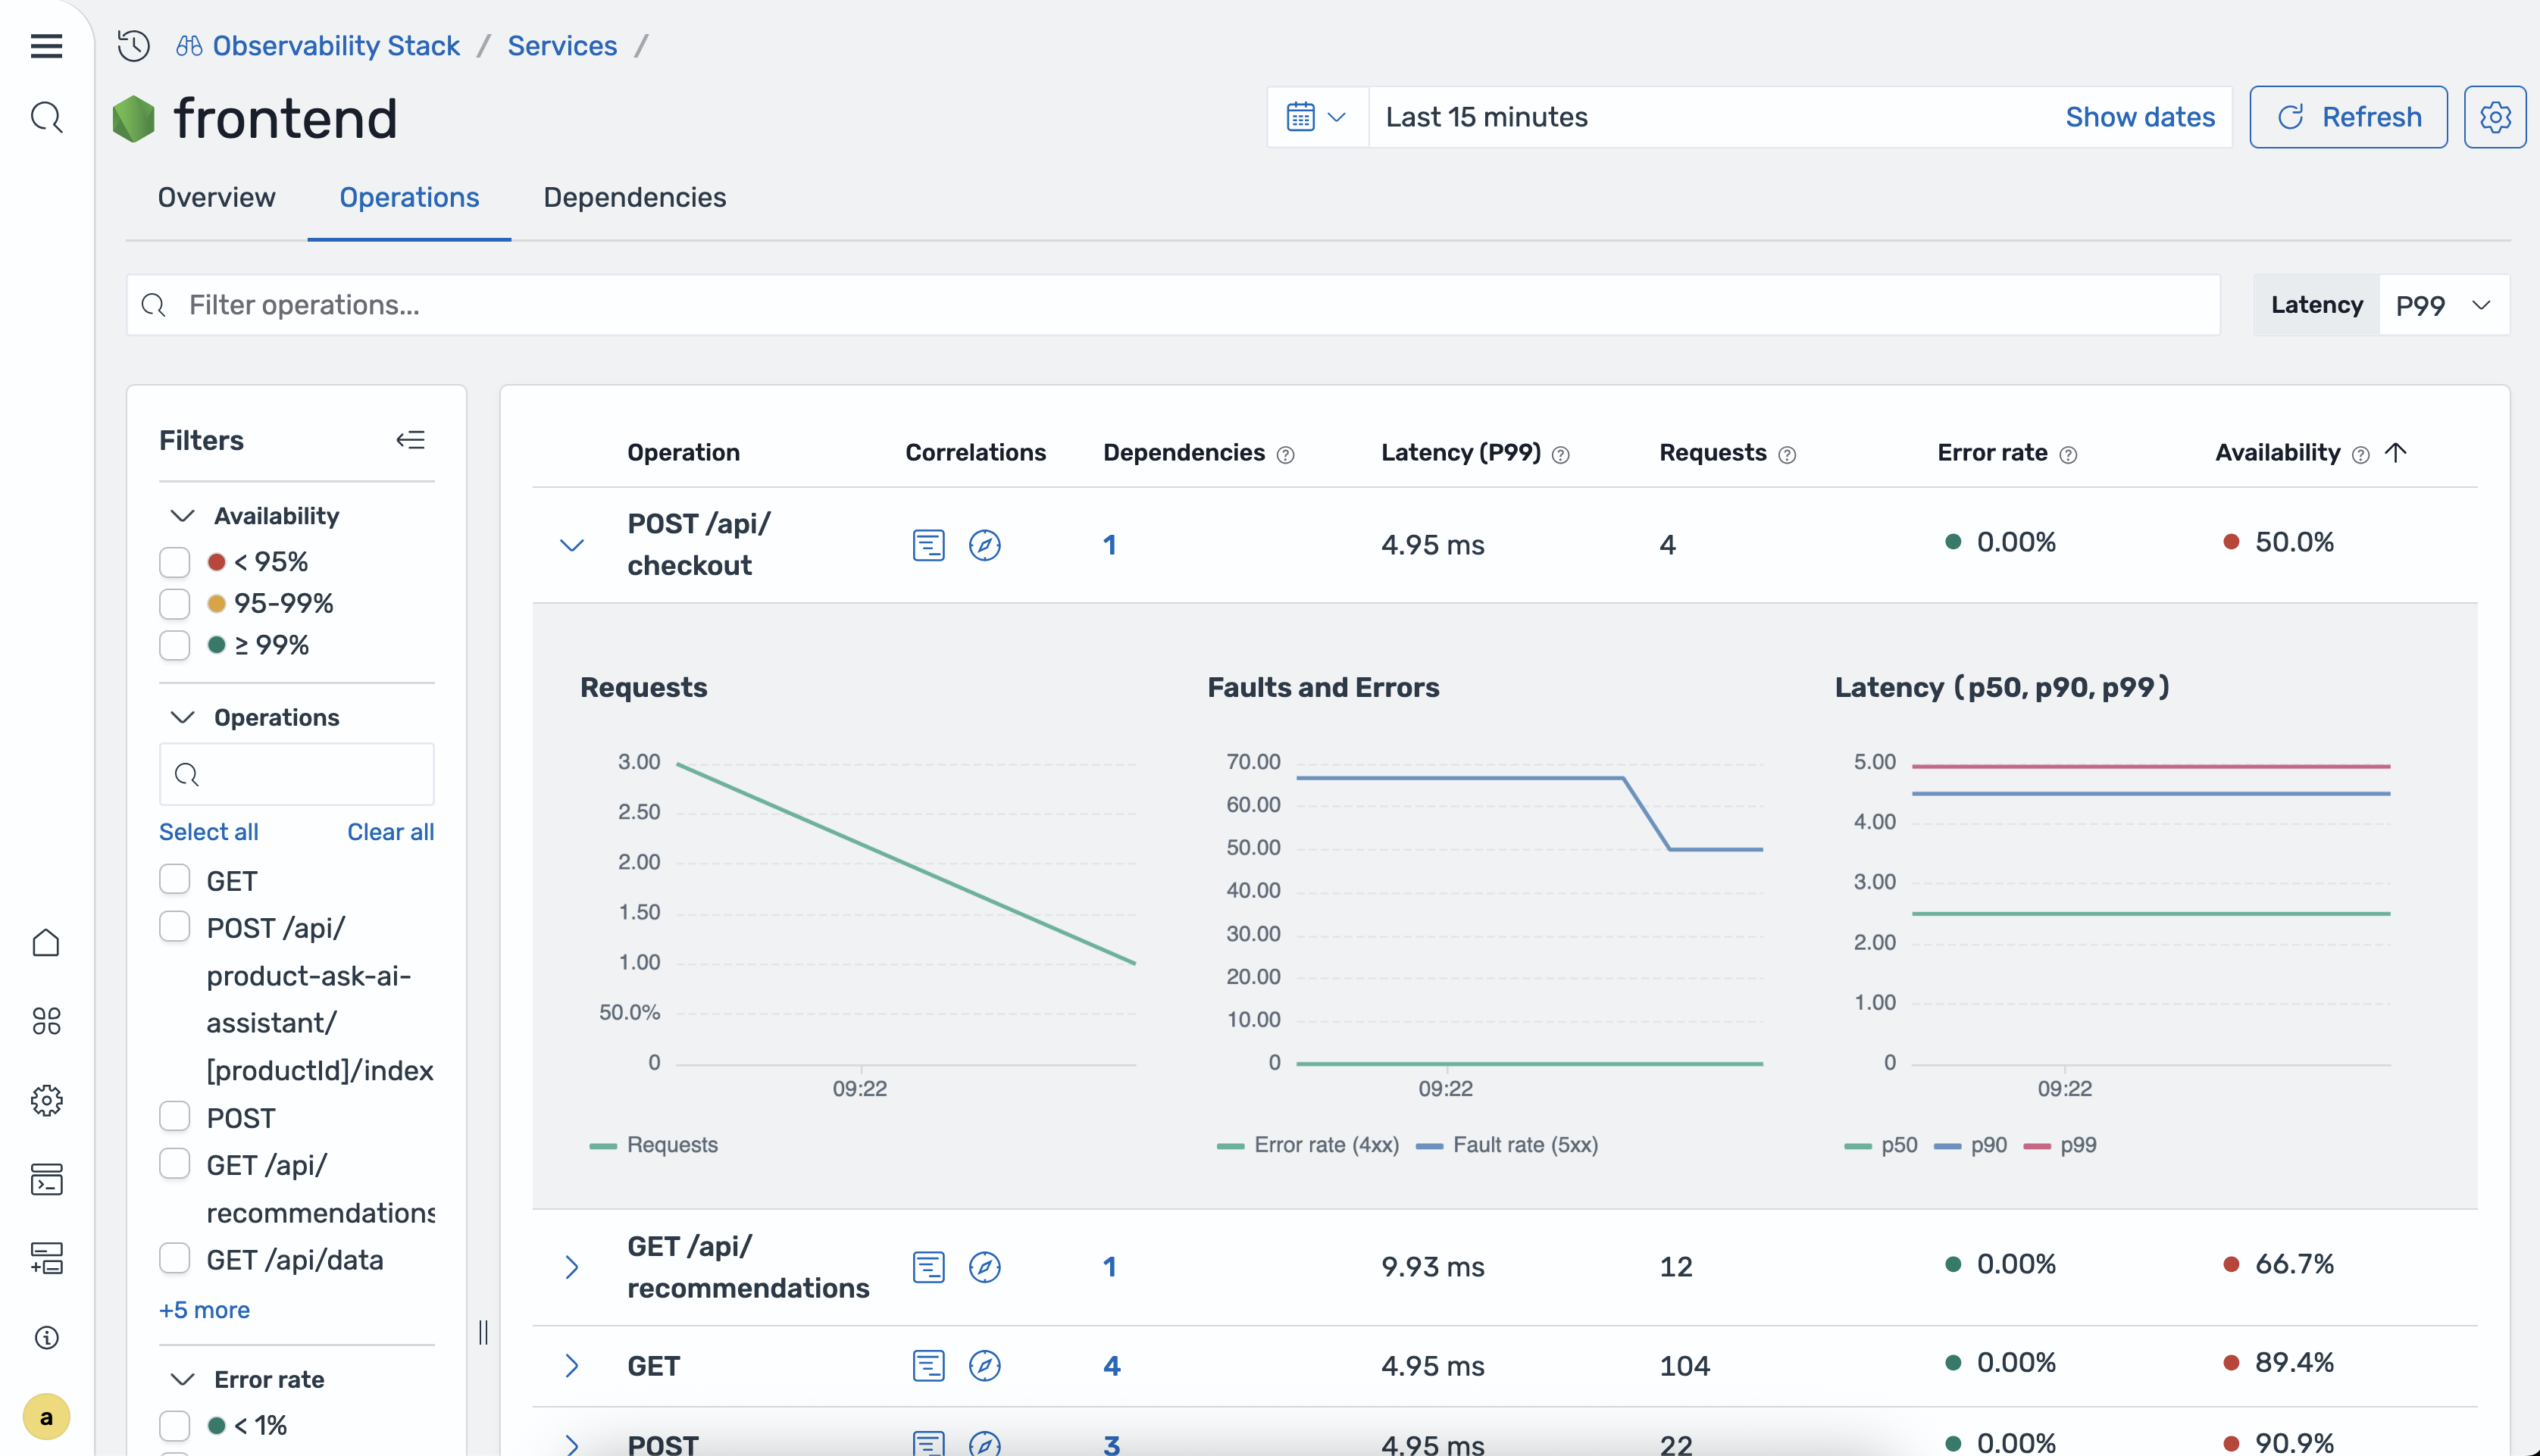
The Operations tab provides a per-operation breakdown of service performance. Each row in the operations table represents a distinct API endpoint or method and displays the following metrics:
- Operation name: The name of the API endpoint or method (for example,
GET /api/products). - P50 latency: The median response time.
- P90 latency: The 90th percentile response time.
- P99 latency: The 99th percentile response time.
- Total requests: The total number of requests for this operation during the selected time range.
- Error rate: The percentage of requests resulting in errors.
- Availability: The availability percentage for this operation.
Use the column headers to sort operations by any metric and identify the slowest or most error-prone endpoints.
Dependencies
The following image shows the Dependencies tab.
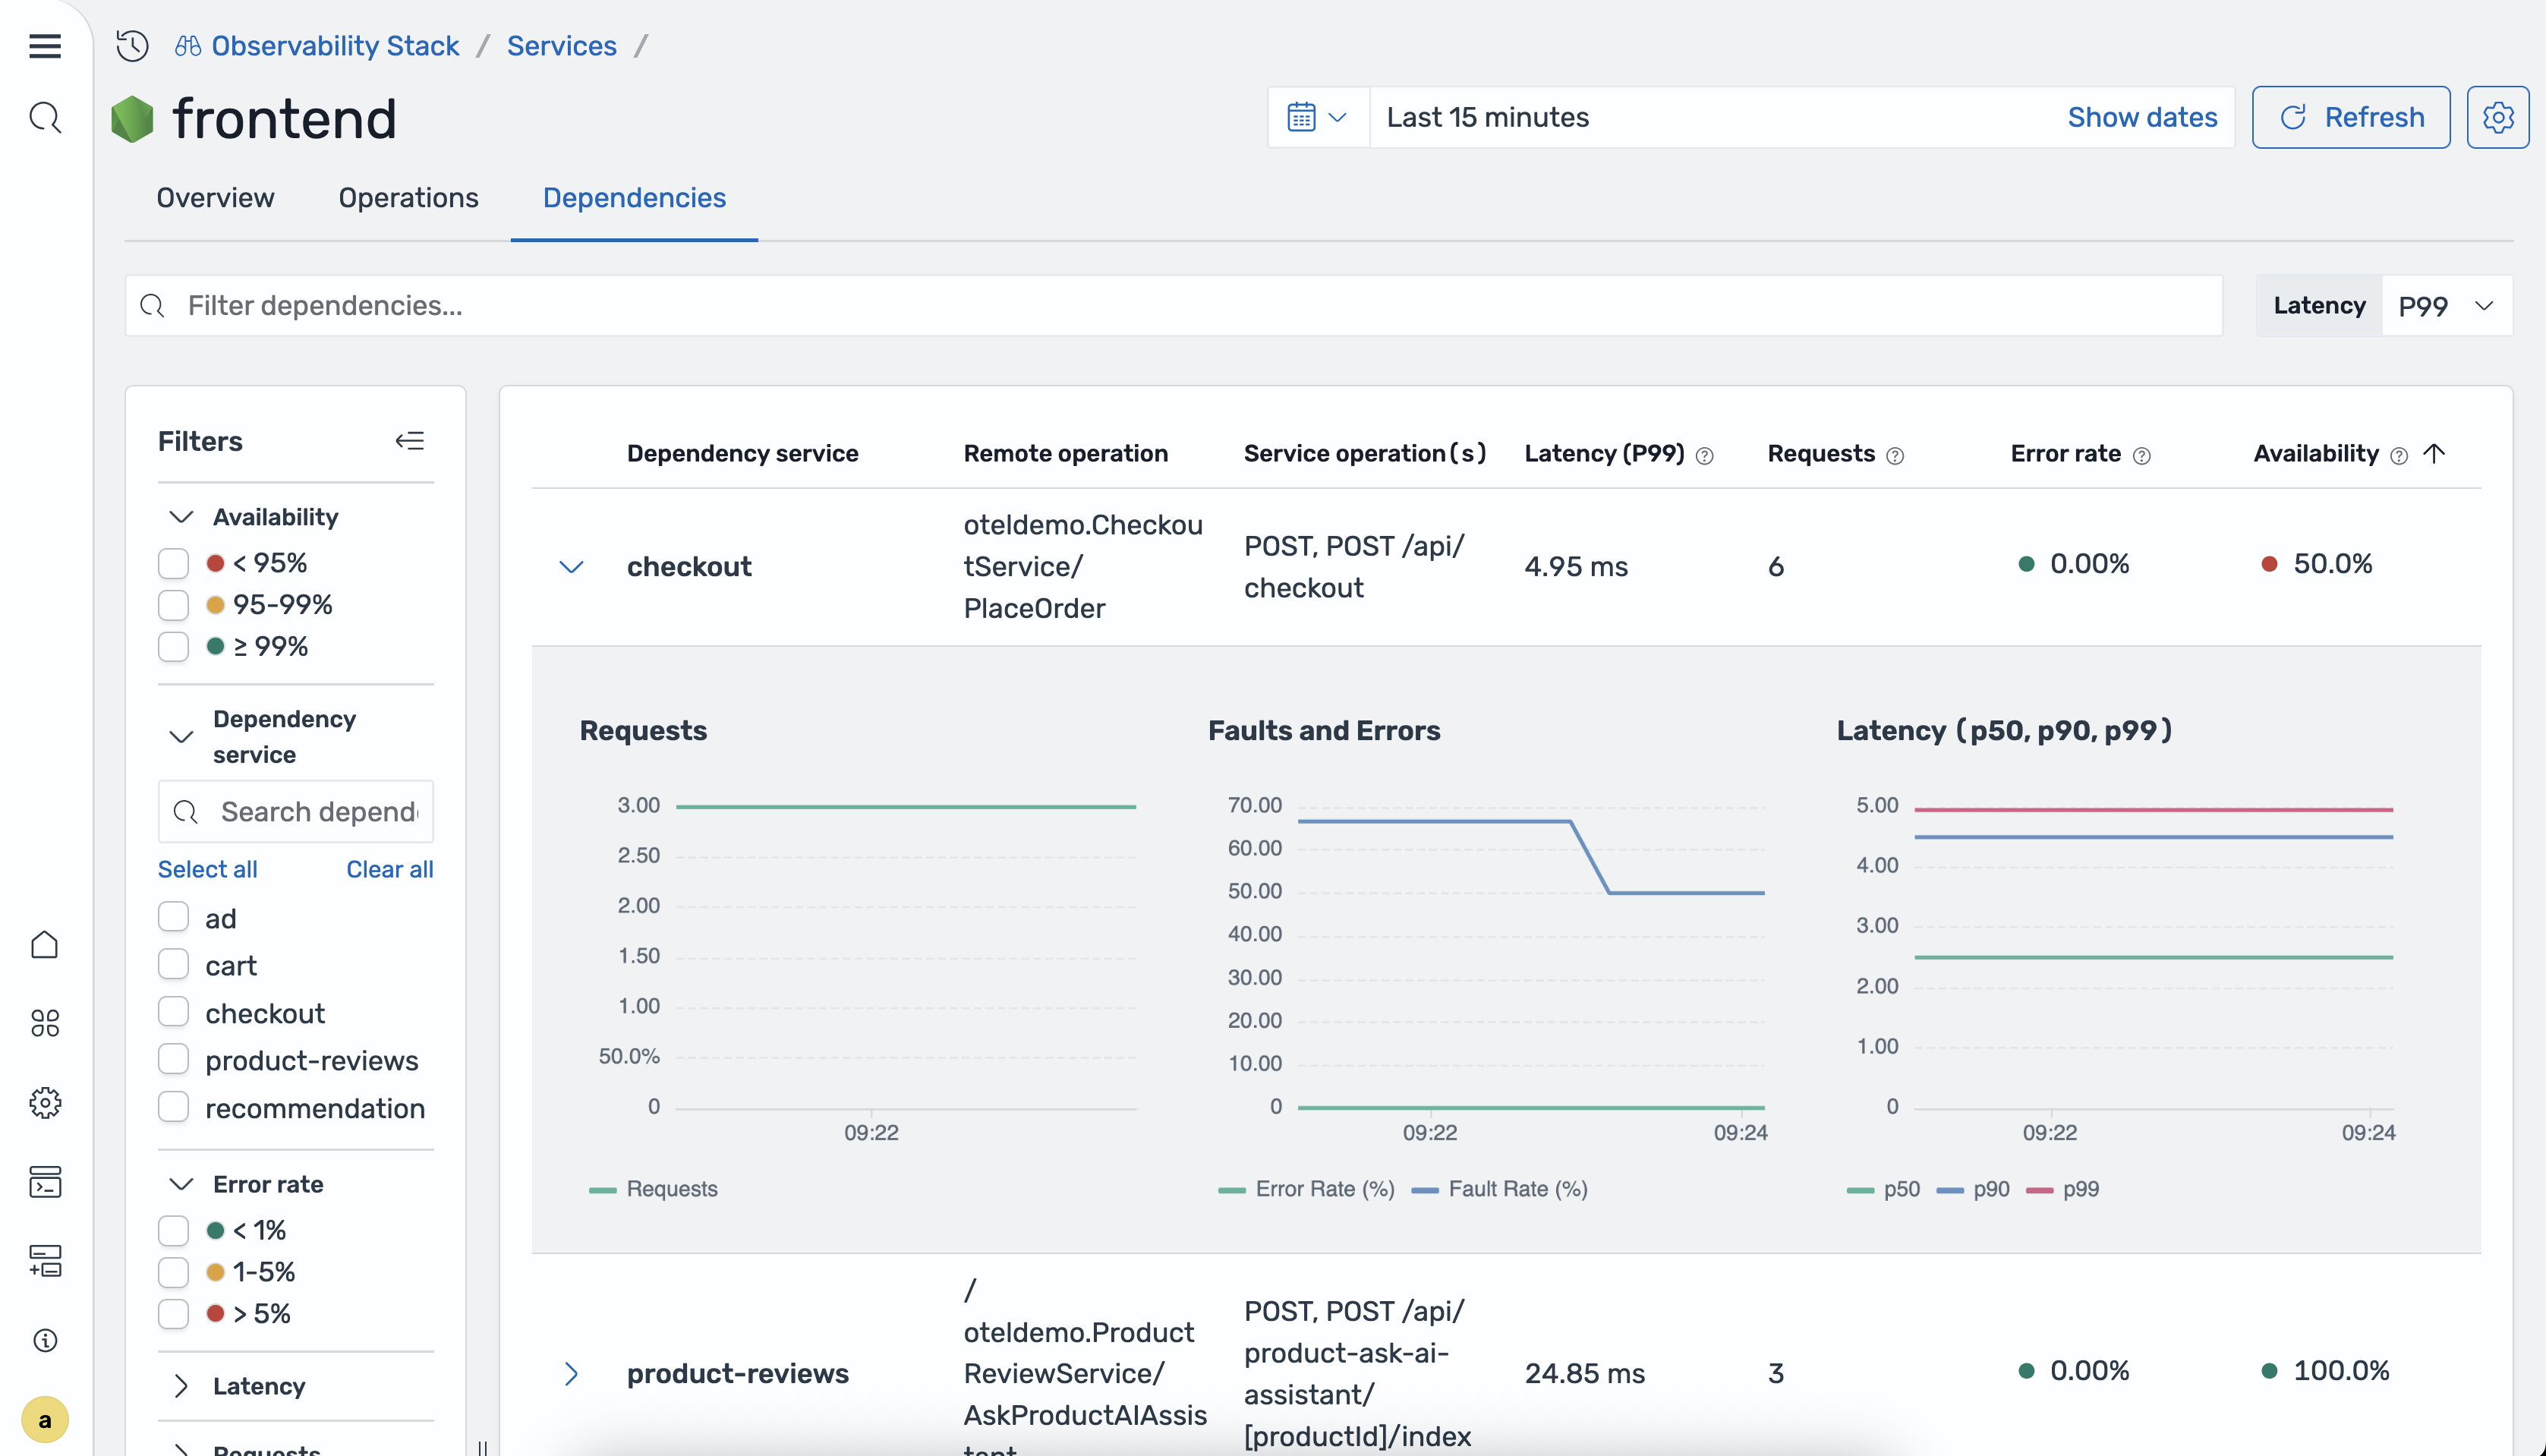
The Dependencies tab shows the downstream services that the selected service calls. For each dependency, the following information is displayed:
- Dependency service: The name of the downstream service being called.
- Remote operation: The specific operation invoked on the downstream service.
- Service operations: The operations on the current service that call this dependency.
- P99 latency: The 99th percentile response time for calls to this dependency.
- P90 latency: The 90th percentile response time for calls to this dependency.
- P50 latency: The median response time for calls to this dependency.
- Total requests: The total number of requests to this dependency during the selected time range.
- Error rate: The percentage of failed calls to this dependency.
- Availability: The availability percentage for this dependency path.
Use this view to determine whether performance issues in a service are caused by its own logic or by a slow or failing downstream dependency.
Correlations
APM provides in-context correlations that allow you to navigate from service metrics directly to related traces and logs. Correlations are accessible from the Services home page, Service overview, and Operations pages.
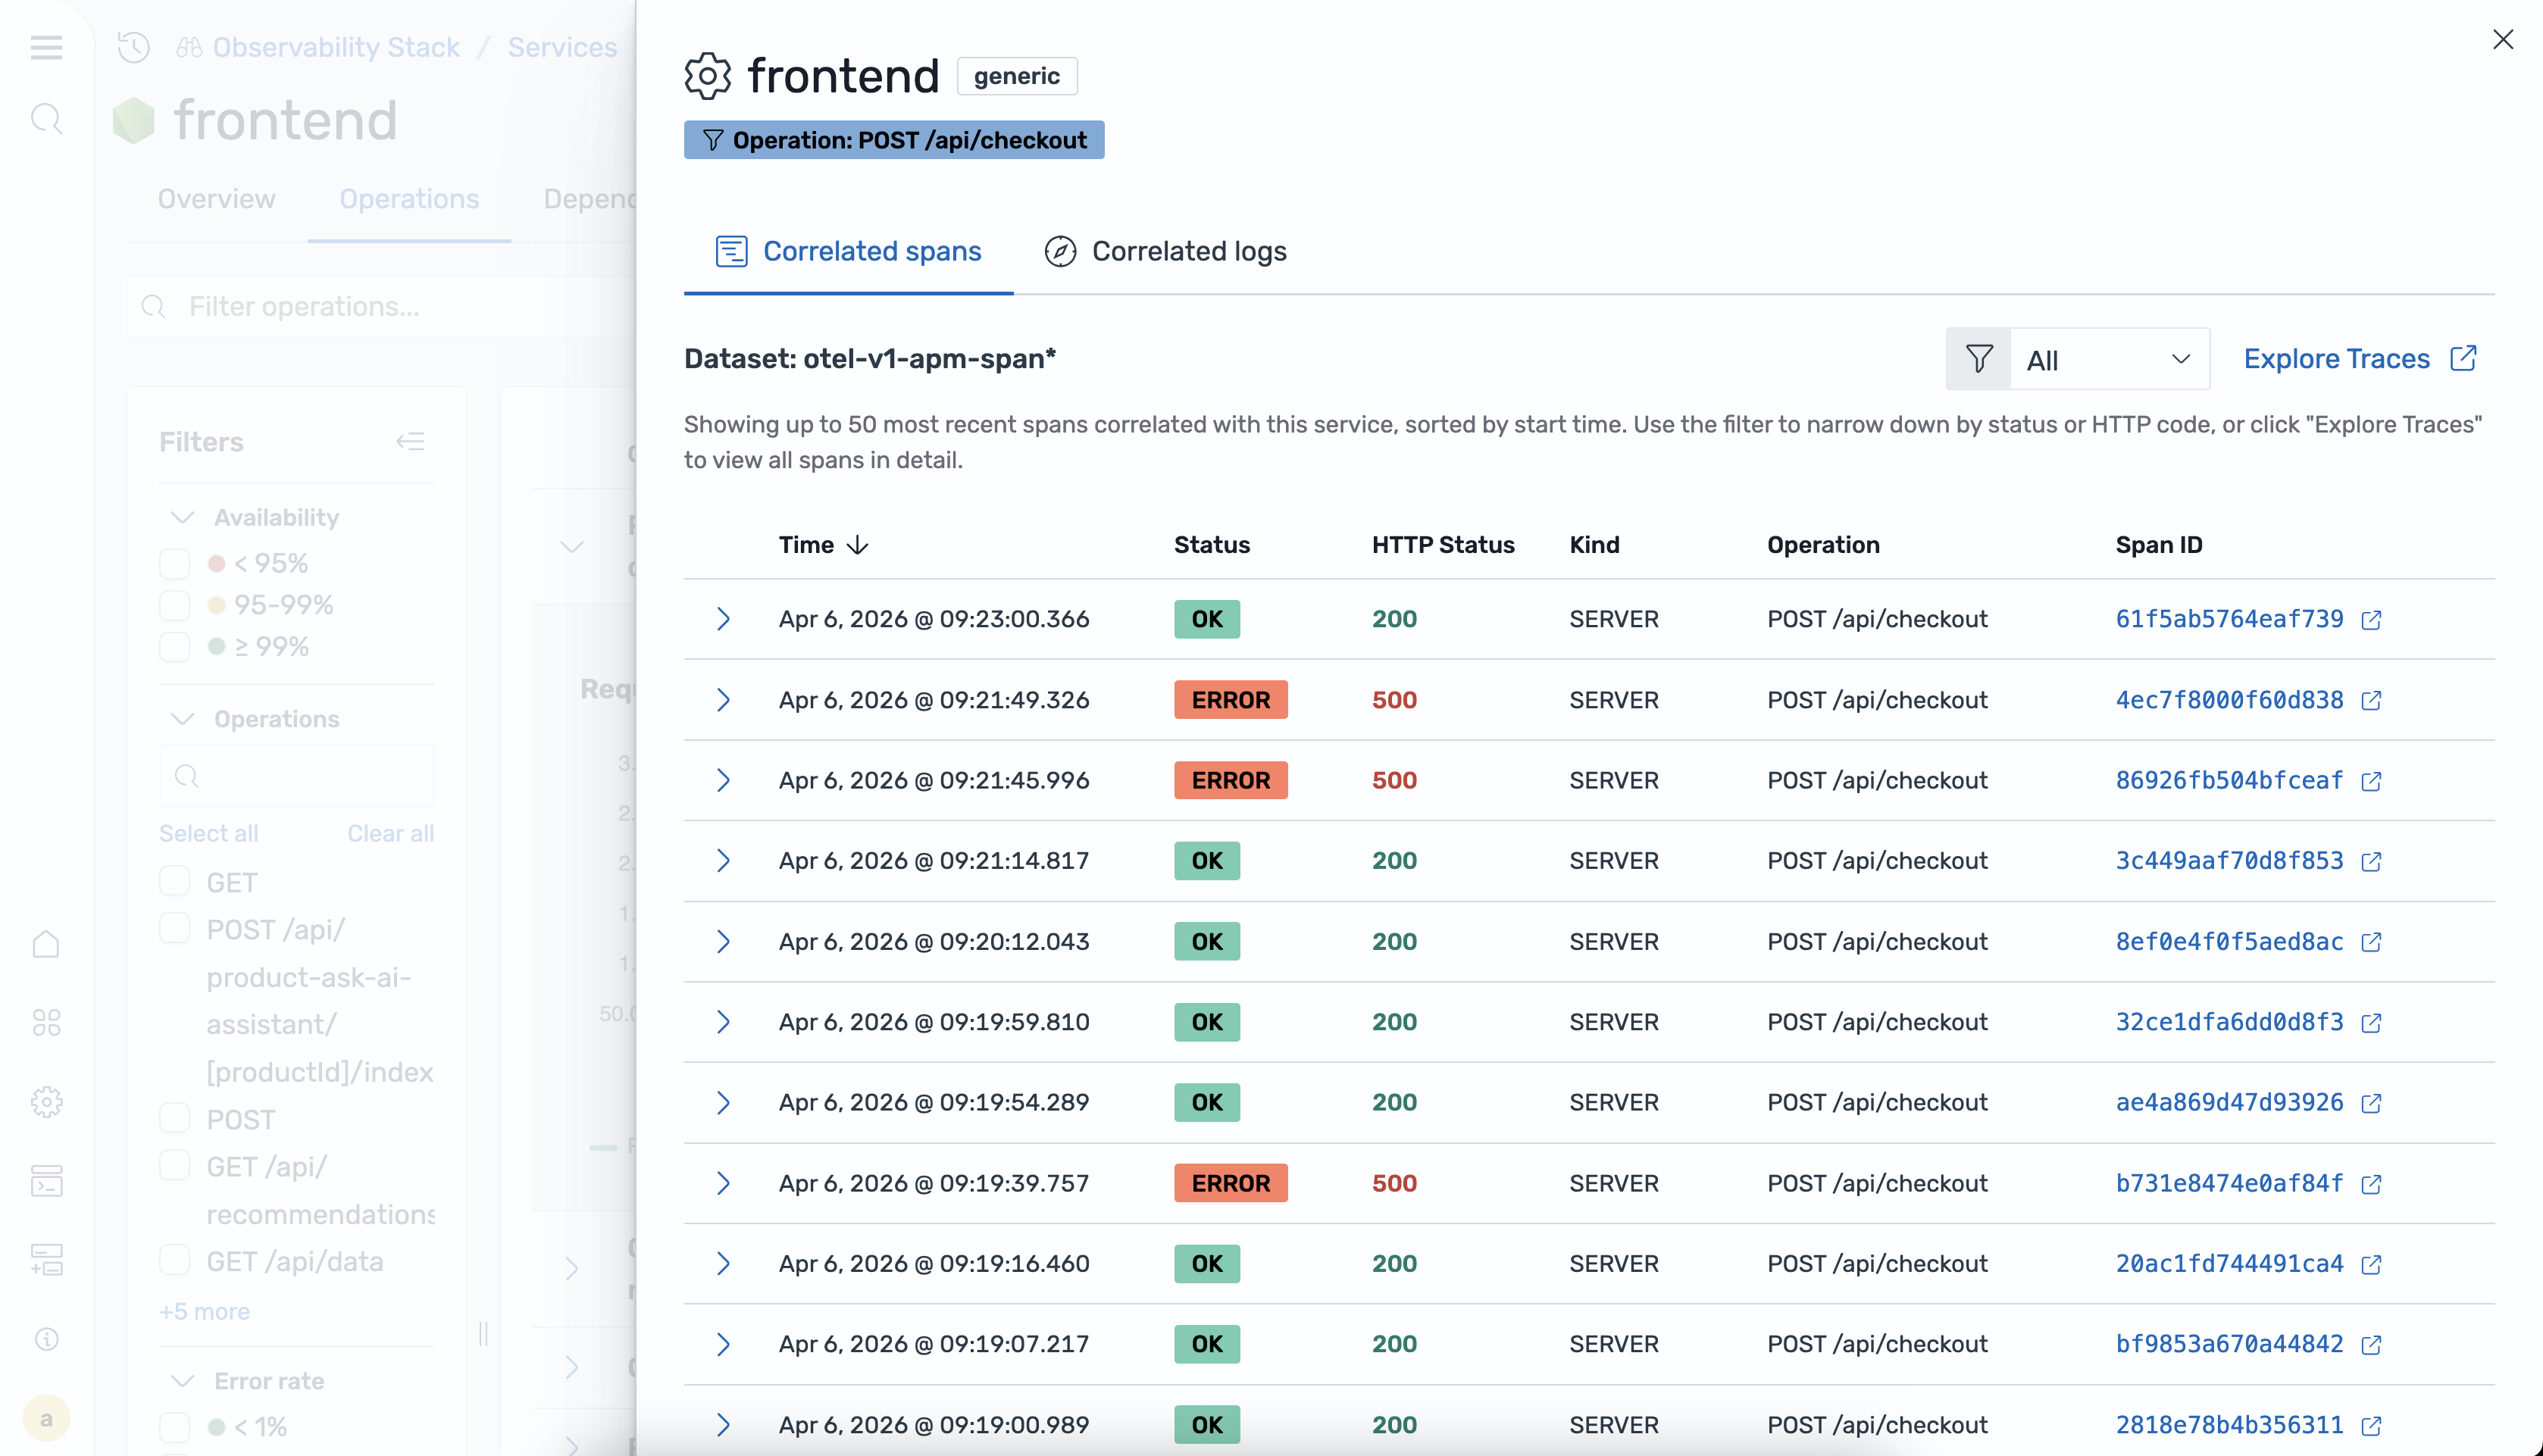
When viewing a service, you can:
- View related traces: Select a metric or operation to open a flyout panel showing correlated trace spans. This helps you drill down from a high-level metric to the individual requests that contributed to it.
- View related logs: The flyout panel also displays log entries associated with the selected traces, giving you full context for debugging issues.
- Filter by attributes: Use service attributes such as environment, operation name, or error type to narrow the correlation results.
For more information about configuring correlations between trace and log datasets, see Correlations.
Filtering services
Use the filter controls at the top of the Services page to narrow the list of displayed services:
- Environment: Filter by deployment environment (for example,
production,staging,development). - Latency: Filter services exceeding a latency threshold.
- Throughput: Filter services by request volume.
- Failure ratio: Filter services with failure ratios that exceed a specified percentage.
You can combine multiple filters to quickly isolate services that match specific criteria, for example, production services with a failure ratio greater than 5%.