Coordinate maps
A coordinate map plots geographic data points on a map using latitude and longitude coordinates. Each marker represents a document with a geo_point field, and marker size indicates the aggregated value at that location.
When to use coordinate maps
Use coordinate maps to reveal distribution patterns and spatial correlations over locations, such as customer locations, service coverage areas, incident distributions, or events with geographic coordinates. You can select geographic regions to filter other visualizations on the same dashboard. For multi-layer geographic visualizations, use the Maps application.
Creating a coordinate map
The examples on this page use the Sample flight data dataset. Before you begin, complete the prerequisites.
To create a coordinate map, follow these steps:
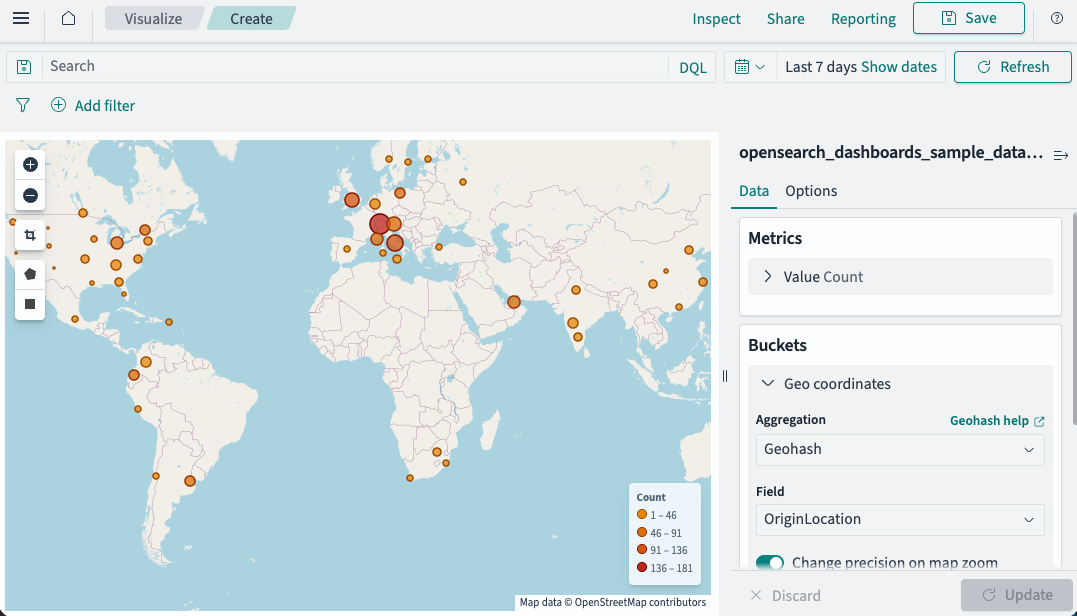
- In the New Visualization dialog, select Coordinate Map, then select your index pattern (for example, opensearch_dashboards_sample_data_flights).
- Set the time filter to Last 7 days.
- Under Buckets, select Add > Geo coordinates.
- Set Aggregation to Geohash and Field to OriginLocation.
- Select Update.
The map displays markers at flight origin locations, with marker size proportional to the document count at each location, as shown in the following image.
Customizing the map display
- Select the Options tab.
- Under Map type, select a marker style: Scaled Circle Markers, Shaded Circle Markers, Shaded Geohash Grid, or Heatmap.
- Adjust Precision to control the geohash bucket size (higher precision = smaller, more numerous buckets).
- Select Update.
Configuring a coordinate map
For information about general visualization configuration, see Configuring visualizations.
Options tab
| Setting | Description |
|---|---|
| Map type | The marker style. Supported values: Scaled Circle Markers (sized by value), Shaded Circle Markers (colored by value), Shaded Geohash Grid (rectangular cells colored by value), Heatmap (continuous color gradient). |
| Precision | Controls the geohash grid resolution. Higher values produce smaller, more numerous buckets. |
| Show tooltips | When enabled, displays aggregation values on hover. |
| WMS compliant map server | When enabled, uses a WMS server for the basemap. For more information, see Configuring a Web Map Service. |
Related documentation
Next steps
- To choose a different visualization type, see Visualization types.
- To add this visualization to a dashboard, see Creating dashboards.