Tag clouds
A tag cloud displays a group of text fields (bucket labels, called tags in the visualization) from the data. The font size of each tag corresponds to the magnitude of the bucket in the data. For example, if the visualization specifies Average, the font size of the tag in the tag cloud is proportional to the bucketed field’s average value.
You can think of a tag cloud as a kind of reverse display that maps bucketed values by displaying the values as the size of the bucket label rather than a graphed quantity such as the length of a bar.
When to use tag clouds
Use tag clouds to provide a dramatic comparison of magnitudes of different text-labeled buckets.
Creating a tag cloud
The examples on this page use the Sample flight data dataset. Before you begin, complete the prerequisites.
To create a tag cloud, follow these steps:
-
In the New Visualization dialog, select Tag Cloud, then select your index pattern (for example, opensearch_dashboards_sample_data_flights).
Since the data is not bucketed, the visualization pane displays
allin large letters. By default the tag size is proportional to the document count, but there are no other terms to compare its size against. - Under Metrics, expand Tag size count.
- Set Aggregation to Unique Count and Field to DestLocation.
- (Optional) Enter a Custom label, for example
Destinations Served. -
Select Update.
The visualization does not change. The tag cloud still has only one entry,
all, because the data has not been bucketed. - Under Buckets, select Add > Tags.
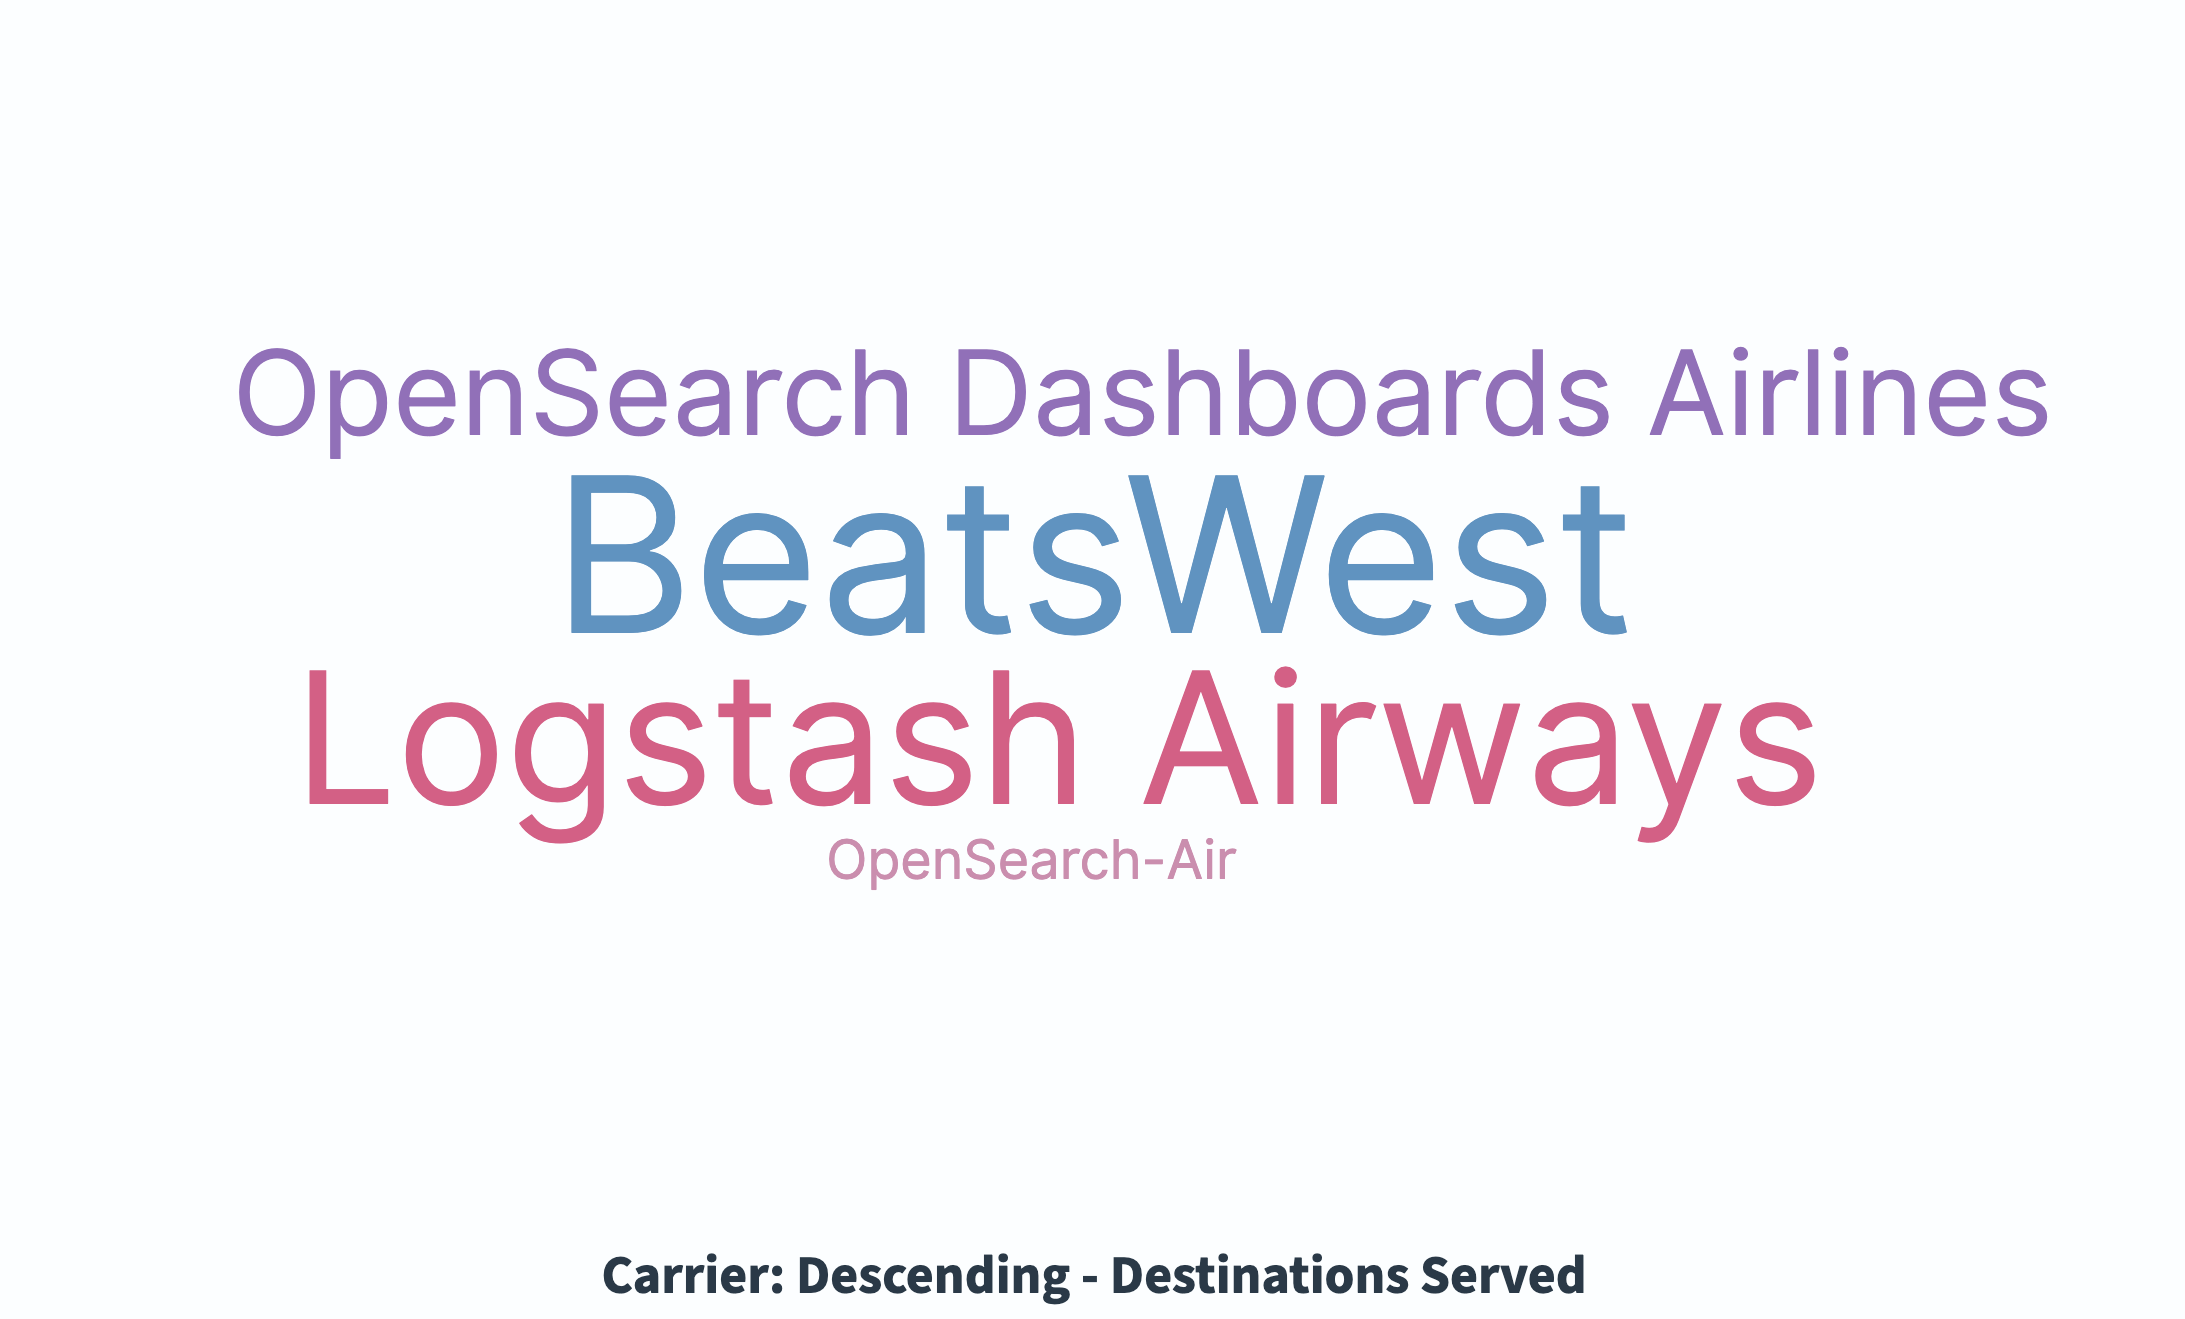
- Set Aggregation to Terms and Field to Carrier.
-
Select Update.
The tag cloud displays each carrier sized by the number of unique destinations, as shown in the following image.
Configuring a tag cloud
For information about general visualization configuration, see Configuring visualizations.
Next steps
- To choose a different visualization type, see Visualization types.
- To add this visualization to a dashboard, see Creating dashboards.