Using OpenSearch Dashboards
OpenSearch Dashboards is the web UI for OpenSearch. It lets you perform most tasks available through the OpenSearch APIs, including:
- Creating indexes and populate them with data.
- Connecting data sources to OpenSearch.
- Using visual filter tools or one of four different query languages to explore data.
- Creating and saving data visualizations and dashboards.
The navigation panel is always available and is the primary way to access applications and features in OpenSearch Dashboards.
Navigating OpenSearch Dashboards
The following image shows the default landing page for OpenSearch Dashboards.
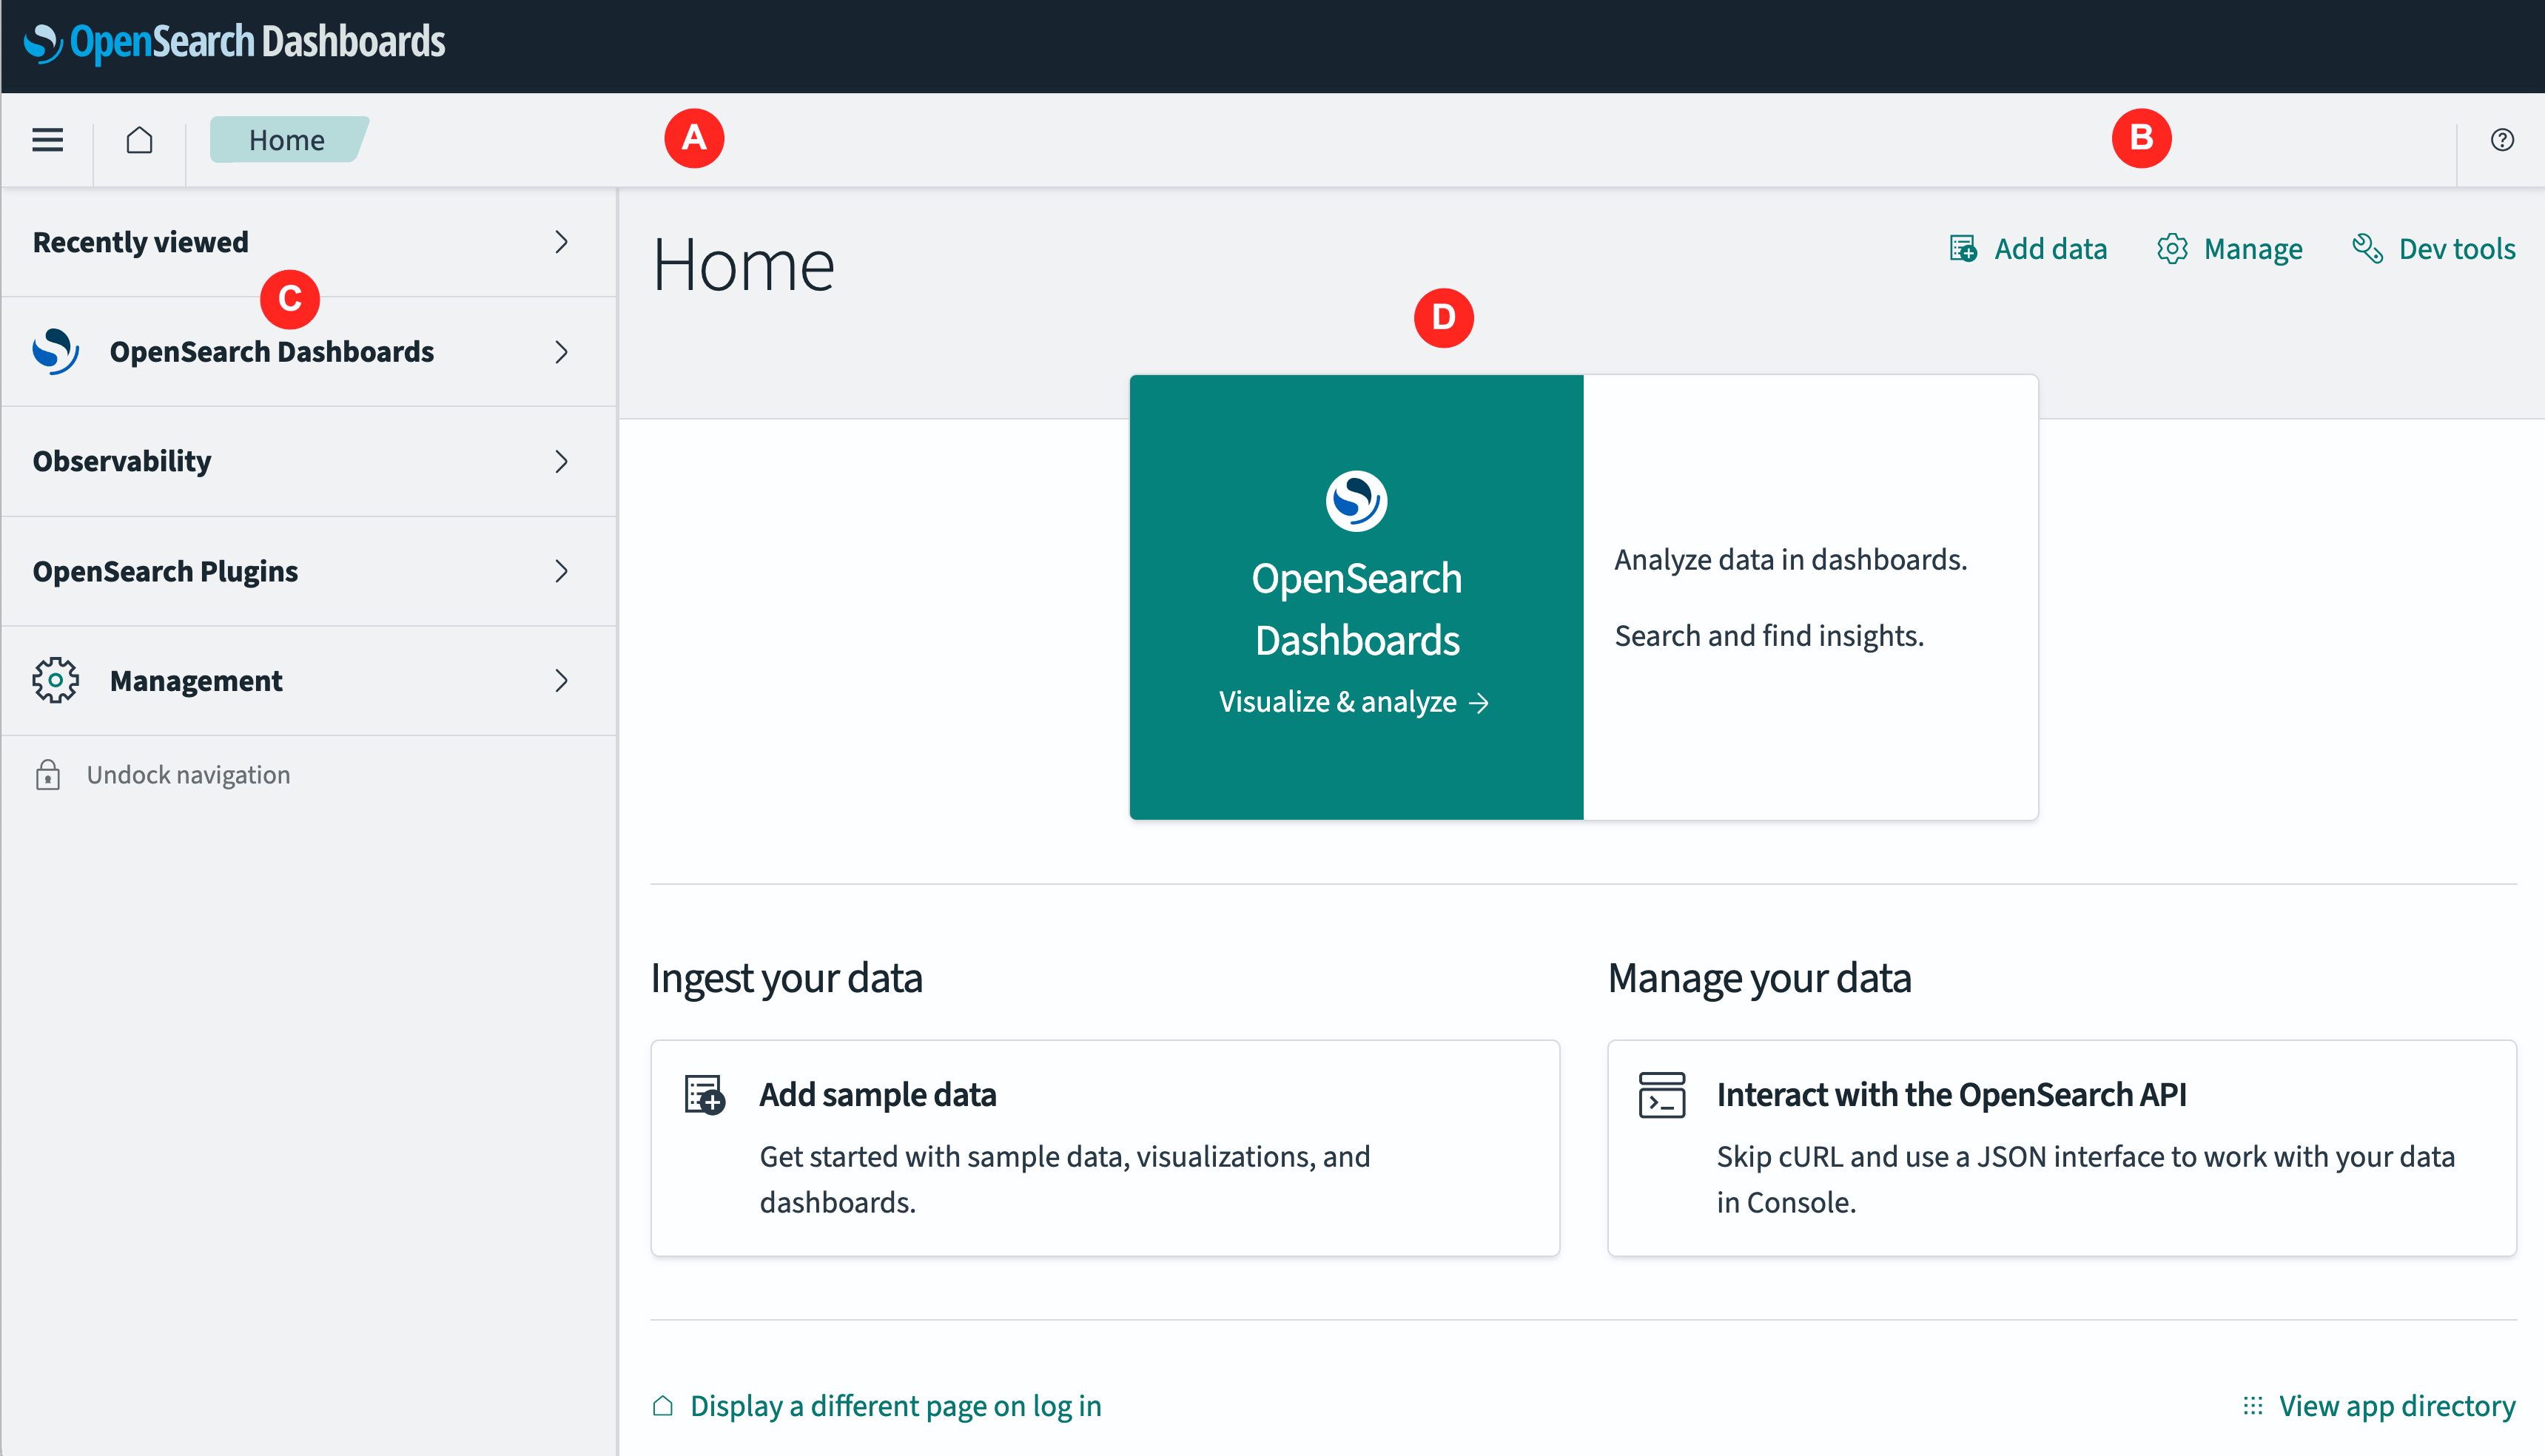
- The header bar (A) contains the following elements from left to right:
 (menu) The menu icon.
 (home) The home icon.
- The breadcrumb display. It contains only one label, “Home”, on the home page.
- The menu area (B). This area, the right portion of the header bar, contains a context-sensitive application menu when an application is active in the main panel.
 (help) The help icon.
- The navigation panel (C) is the primary means of navigating OpenSearch Dashboards. It contains collapsible menus grouped by function (Recently viewed, OpenSearch Dashboards apps, Observability, and so on). See Using the navigation panel.
- The panel or main panel (D) contains the current application or UI page.
Workspaces navigation
Introduced 2.18.0
OpenSearch Dashboards offers an alternative navigation mode called workspaces navigation. The functionality is roughly equivalent between the two modes, with the following differences:
- Workspaces navigation centers on workflows that use the Workspace feature.
- The arrangement of menu trees and navigation is different in the two modes, including the organization of the navigation panel.
- The look and feel is different in workspaces navigation.
- Workspaces navigation is enabled by setting
workspace.enabled: trueinopensearch_dashboards.yml. See Using the OpenSearch Dashboards setup menu.
Where applicable, the following sections describe, in parallel, how to use both navigation modes. The differences are mostly in the arrangement of the navigation panel.
Using the navigation panel
Use the navigation panel on the left side of the UI to select any application or settings page that you want to use.
The images below show the most-used features on both navigation modes (classic and workspaces).
| Classic navigation panel | Workspaces navigation panel |
|---|---|
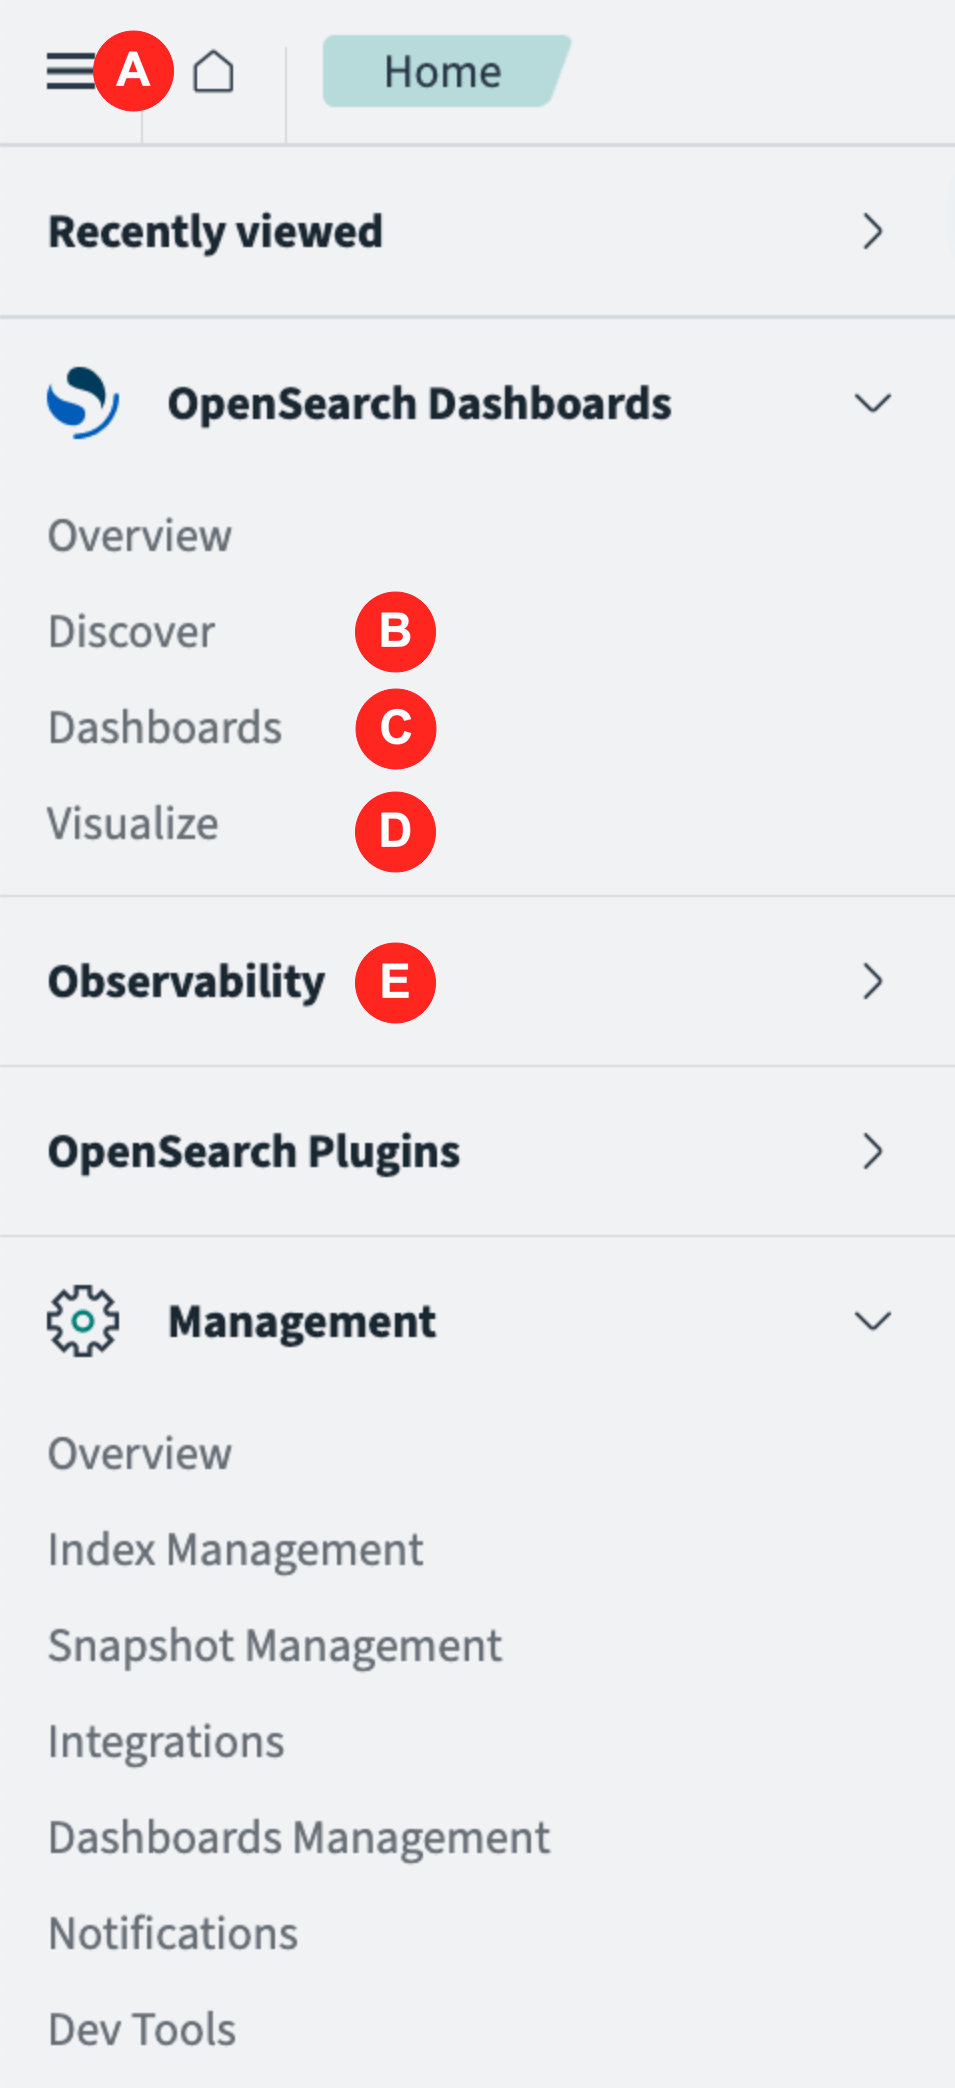 | 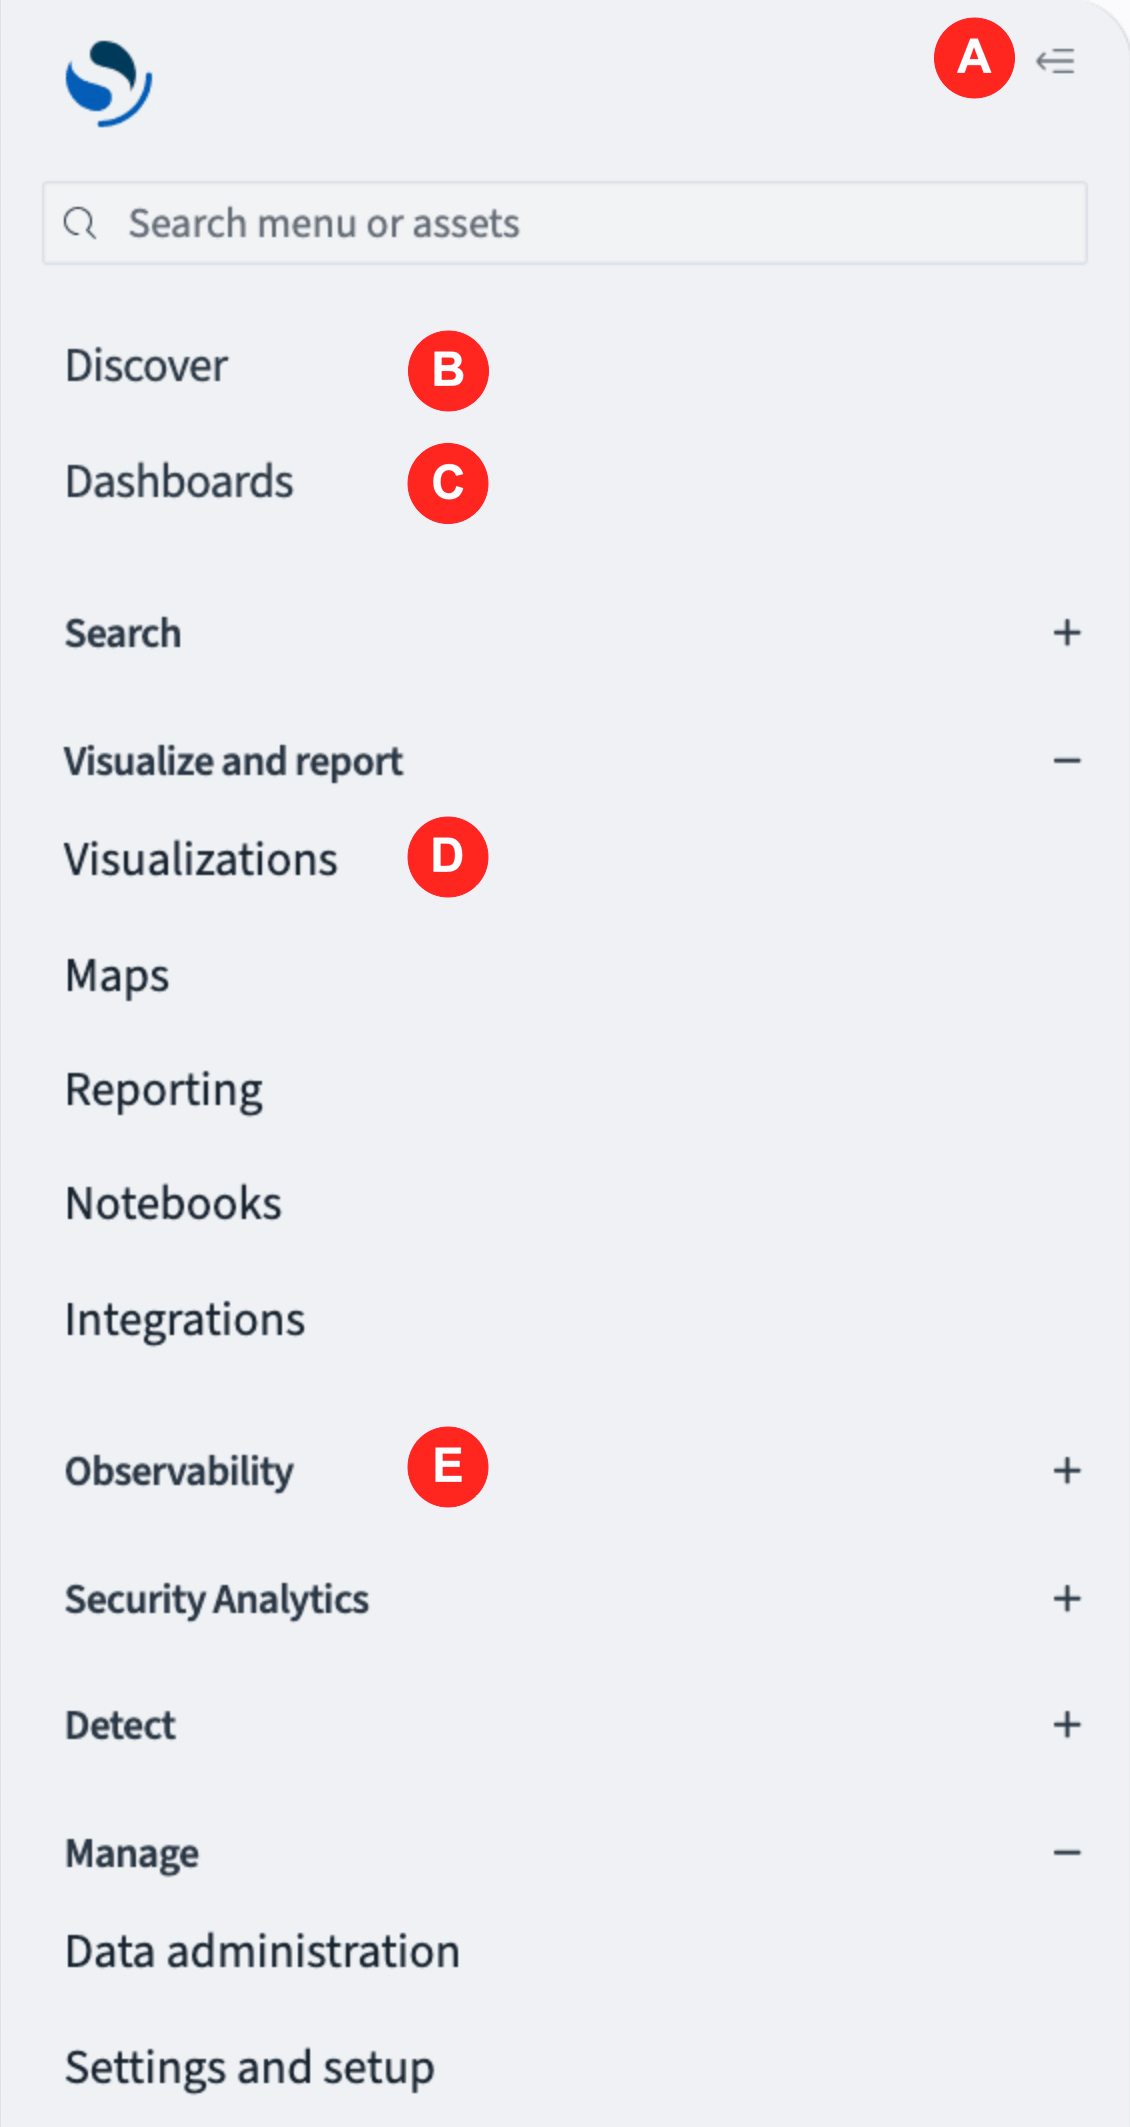 |
- The menu icon (A) hides and reveals the navigation panel. To enlarge the application panel, you can hide and unhide the navigation panel.
- Discover (B) opens the Discover application in the main panel. See Exploring data with Discover.
- Dashboards (C) opens the Dashboards application in the main panel. See Creating dashboards.
- Visualize (D) opens the Visualize application in the main panel. See Building data visualizations.
- Observability (E) opens the Observability menu in the navigation panel. See Observability.
Hiding the navigation panel
To hide the navigation panel, follow these steps:
-
In classic navigation In workspaces navigation - Select  (dock) Undock navigation at the bottom of the navigation panel.
- Select the (menu) icon or  (cross) to the right of the menu.
- Select the  (collapse navigation) icon.
Unhiding the navigation panel
To unhide the navigation panel, follow these steps:
-
In classic navigation In workspaces navigation - Select the (menu) icon.
- Select (undock) Dock navigation at the bottom of the navigation panel.
- Select the (menu) icon.
Using the OpenSearch Dashboards setup menu
OpenSearch Dashboards has many settings that control display, logging, search, and various UI behaviors. Some settings enable experimental functionality.
You can set these parameters by editing the opensearch_dashboards.yml file. See Configuring OpenSearch Dashboards.
You can use OpenSearch Dashboards to configure many of the same settings.
To configure a setting, do the following:
-
In classic navigation In workspaces navigation - Select Management > Dashboards Management.
- In the Dashboards Management panel, select Advanced settings.Select Settings and setup > Application settings. Some of these settings enable experimental features or can subvert expected behavior. We recommend not changing a setting unless you’re sure of its effects.
-
(Optional) Select one or more setting categories from the Category drop-down to filter the settings list.
-
(Optional) Enter a search term in the Search text box to filter the settings list.
-
Select or enter the value for the setting you want to change.
For example, to use workspaces navigation, select the Try the new home page toggle to enable it.
- Select the Save changes button.