Explore the Discover application
The Discover application lets you search, filter, and examine your data interactively. Use it to understand what fields are available, how data is distributed over time, and what patterns exist.
With Discover, you can:
- Choose data for analysis, set a time range for that data, search the data, and filter the results.
- Analyze your data: query and filter data, view results in a table, and examine documents.
- Create histograms to display the distribution of your data.
In the search bar of the Discover and Dashboards applications, you can write queries in Dashboards Query Language (DQL)—a simple text-based language for filtering data using field names and values. You can also switch to query string (Lucene) syntax.
Prerequisites
The examples on this page use the Sample flight data dataset that is already installed in OpenSearch Playground.
If you’re using a local installation of OpenSearch Dashboards and haven’t added sample data yet, see Prepare your data.
Try it: Search and filter flight data
Follow these steps to use the Discover application:
-
From the navigation panel, select OpenSearch Dashboards > Discover.
-
On the Discover page, select the index pattern
opensearch_dashboards_sample_data_flightsfrom the dropdown menu on the upper left. -
Select the
 (calendar) icon to change the time filter from the default of Last 15 minutes to Last 7 days.
 -
In the DQL search bar, enter the following query:
FlightDelay:true AND DestCountry: US AND FlightDelayMin >= 60 -
Select Update.
Results are shown for US-bound flights delayed by 60 minutes or more.
-
Filter data by selecting
 (plus) Add filter from the DQL search bar and then selecting a Field, Operator, and Value from the dropdown lists in the Edit Filter popover. For example, select
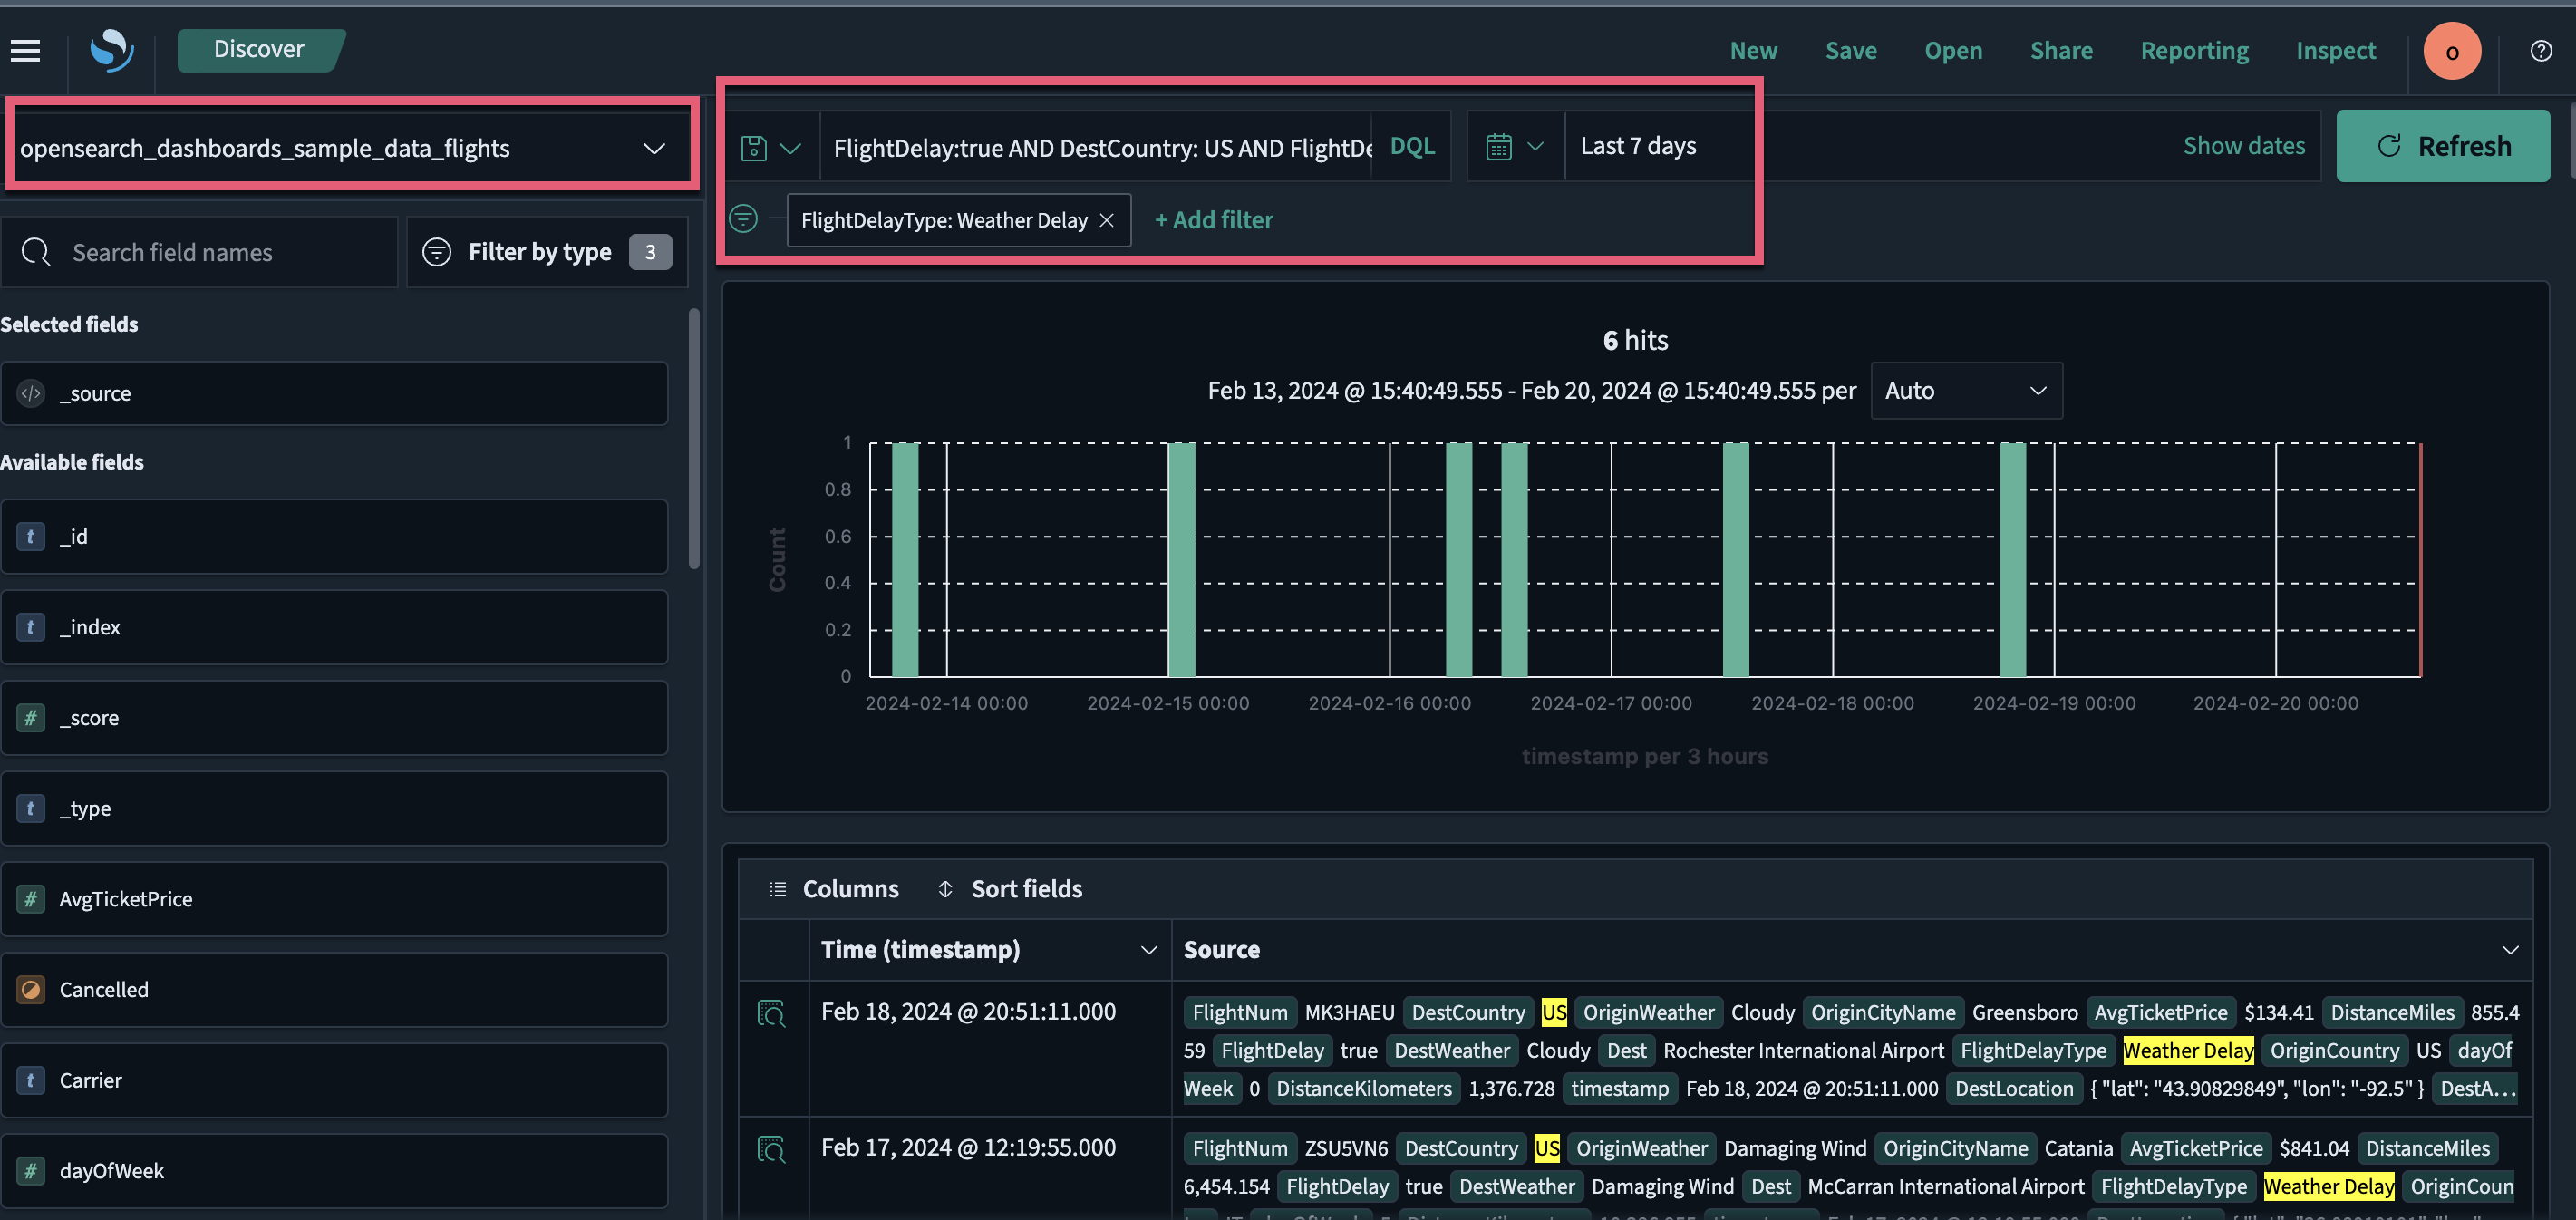
 FlightDelayType, is, and Weather Delay. -
Select Save.
The resulting view is shown in the following image.
Further reading
- For the full Discover reference, see Exploring data with Discover.
- For a DQL reference, see Dashboards Query Language.
Next steps
- Create a visualization from your data using Explore the Visualize application.