Controls
Experimental
This is an experimental feature and is not recommended for use in a production environment. For updates on the progress of the feature or if you want to leave feedback, join the discussion on the OpenSearch forum.
A controls visualization adds interactive filter panels to a dashboard. Controls let you filter data without modifying the dashboard itself.
Controls do not require a data source. You configure the data source within each individual control.
When to use controls
Use controls to filter data within a dashboard. Many visualizations have data selection filtering built in. Use controls with visualizations that don’t already offer data selection or to enhance the data selection capability of an existing visualization.
Control types
Two types of controls are available:
- Range slider: Defines minimum and maximum values for a numeric field.
- Options list: Provides a dropdown to select values from a field.
Creating a controls visualization
To create a controls visualization, follow these steps:
- In the New Visualization dialog, select Controls.
- Select the Controls tab.
- From the Type dropdown, select Range slider or Options list.
- Select Add.
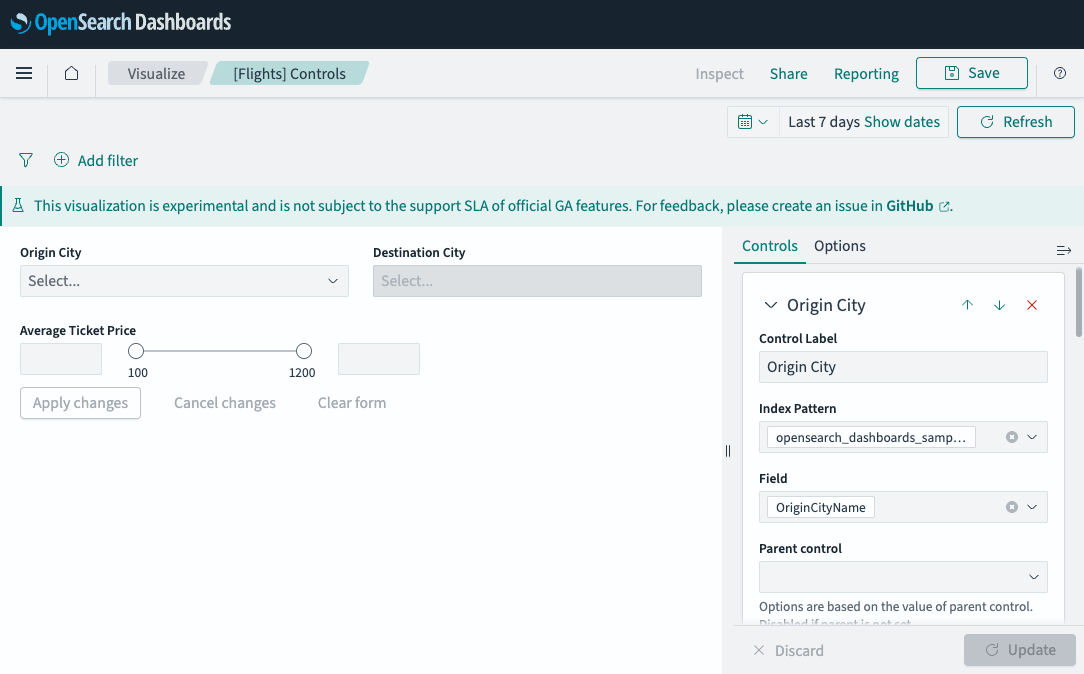
The following image shows a controls visualization with two Options list controls (Origin City and Destination City) and one Range slider control (Average Ticket Price).
Configuring a range slider
- In Control Label, enter the label that appears on the control.
- From Index Pattern, select the data source.
- From Field, select a numeric field.
- (Optional) Set a Step Size (minimum increment) and Decimal Places.
- Select Update.
Configuring an options list
- In Control Label, enter the label that appears on the control.
- From Index Pattern, select the data source.
- From Field, select the field to filter by.
- (Optional) Enable Multi-select to allow selecting multiple values.
- (Optional) Enable Dynamic Options to automatically scale the dropdown items (text fields only).
-
If Dynamic Options is disabled, set the Size (number of items shown).
The control displays only the top Size values, as determined by the data field’s sorting method.
- Select Update.
You can add multiple controls to a single visualization by repeating the steps.
Next steps
- To choose a different visualization type, see Visualization types.
- To add this visualization to a dashboard, see Creating dashboards.