Region maps
A region map colors geographic regions (countries, states, or counties) based on an aggregated value, using color intensity to show how a metric varies across regions.
When to use region maps
Use region maps to compare data values aggregated by geographic boundaries, such as sales by country, population by state, or incidents by county. For multi-layer geographic visualizations, use the Maps application.
Creating a region map
The examples on this page use the Sample flight data dataset. Before you begin, complete the prerequisites.
To create a region map, follow these steps:
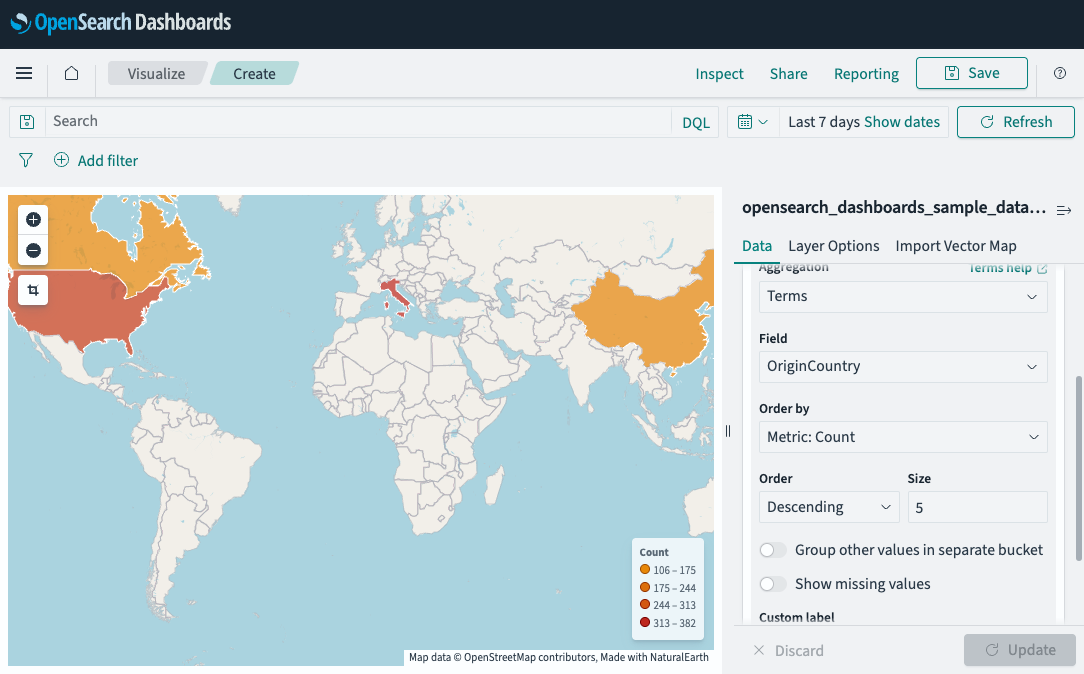
- In the New Visualization dialog, select Region Map, then select your index pattern (for example, opensearch_dashboards_sample_data_flights).
- Set the time filter to Last 7 days.
- Under Buckets, select Add > Shape field.
- Set Aggregation to Terms and Field to OriginCountry.
- Select Update.
The map colors each country by its flight count, as shown in the following image.
Customizing the map display
- Select the Options tab.
- Under Layer settings, select a vector map (for example, World Countries).
- In Join field, select the field in the vector map that matches your data (for example,
ISO 3166-1 alpha-2). - Under Style settings, adjust the color schema.
- Select Update.
Using custom vector maps with GeoJSON
If the built-in vector maps do not include the regions you need (for example, US counties or ZIP codes), you can upload a custom GeoJSON file.
To use a custom vector map with GeoJSON, install the following plugins:
- OpenSearch Dashboards Maps
dashboards-mapsfront-end plugin - OpenSearch
geospatialbackend plugin
Uploading a custom GeoJSON file
- Prepare a JSON file with either a
.geojsonor.jsonextension. - In the Region Map editor, in the right panel, select Import Vector Map.
- In Upload map, select or drag and drop your JSON file.
- Enter a Map name prefix (for example,
usa-counties). The map name becomes<prefix>-map. - Select Import file, then select Refresh in the confirmation popup.
Selecting the custom vector map
- In Layer Options > Layer settings, select Custom vector map.
- Under Vector map, select the map you uploaded.
- (Optional) Under Style settings, increase Border thickness for visibility.
- Select Update.
Example GeoJSON file
The following GeoJSON file defines two US counties:
{
  "type": "FeatureCollection",
  "name": "usa counties",
  "features": [
    {
      "type": "Feature",
      "properties": { "iso2": "US", "iso3": "LA-CA", "name": "Los Angeles County", "country": "US", "county": "LA" },
      "geometry": { "type": "Polygon", "coordinates": [[[-118.718, 34.071], [-118.696, 34.034], [-118.570, 34.030], [-118.488, 33.957], [-118.372, 33.861], [-118.455, 33.756], [-118.339, 33.715], [-118.229, 33.756], [-118.141, 33.679], [-117.911, 33.578], [-117.751, 33.496], [-117.559, 33.555], [-117.307, 33.596], [-117.070, 33.674], [-116.697, 34.062], [-116.944, 34.284], [-117.180, 34.430], [-117.378, 34.543], [-117.625, 34.570], [-118.048, 34.615], [-118.449, 34.543], [-118.619, 34.389], [-118.740, 34.212], [-118.718, 34.071]]] }
    },
    {
      "type": "Feature",
      "properties": { "iso2": "US", "iso3": "SD-CA", "name": "San Diego County", "country": "US", "county": "SD" },
      "geometry": { "type": "Polygon", "coordinates": [[[-117.235, 32.861], [-117.241, 32.755], [-117.164, 32.681], [-117.142, 32.584], [-117.092, 32.463], [-117.054, 32.292], [-116.960, 32.194], [-116.856, 32.166], [-116.675, 32.204], [-116.367, 32.320], [-116.147, 32.551], [-116.164, 32.806], [-116.411, 33.073], [-116.730, 33.082], [-117.092, 32.995], [-117.252, 32.963], [-117.235, 32.861]]] }
    }
  ]
}
Configuring GeoJSON complexity
The complexity of uploaded GeoJSON files is configured using the following cluster settings:
| Setting | Default | Description |
|---|---|---|
plugins.geospatial.geojson.max_coordinates_per_geo | 10000 | Maximum number of coordinates allowed per geometry. |
plugins.geospatial.geojson.max_holes_per_polygon | 1000 | Maximum number of holes allowed per polygon. |
plugins.geospatial.geojson.max_multi_geometries | 100 | Maximum number of geometries in a multi-geometry object. |
plugins.geospatial.geojson.max_geometry_collection_nested_depth | 5 | Maximum nested depth for geometry collections. |
For more information about updating dynamic settings, see Dynamic settings.
Configuring a region map
For information about general visualization configuration, see Configuring visualizations.
Options tab
| Setting | Description |
|---|---|
| Vector map | The basemap containing geographic boundaries. Select a built-in map or a custom uploaded map. |
| Join field | The field in the vector map used to match your data values. |
| Color schema | The color gradient used to represent values. |
| Show tooltips | When enabled, displays region values on hover. |
Next steps
- To choose a different visualization type, see Visualization types.
- To add this visualization to a dashboard, see Creating dashboards.