Markdown visualizations
A Markdown visualization renders formatted text within a dashboard panel. Use Markdown to provide titles, instructions, metric definitions, and explanatory context alongside data visualizations. Markdown supports headings, lists, bold and italic text, links, blockquotes, and code blocks (GitHub-flavored Markdown).
Markdown visualizations do not require a data source.
When to use Markdown visualizations
Use Markdown visualizations to add context that helps you interpret the data on a dashboard. Common use cases include:
- Dashboard titles and section headers
- Instructions for interacting with filters and controls
- Definitions of key metrics shown in other panels
- Links to related dashboards or external documentation
- Status notes such as data refresh intervals or maintenance schedules
Creating a Markdown visualization
- In the New Visualization dialog, select Markdown.
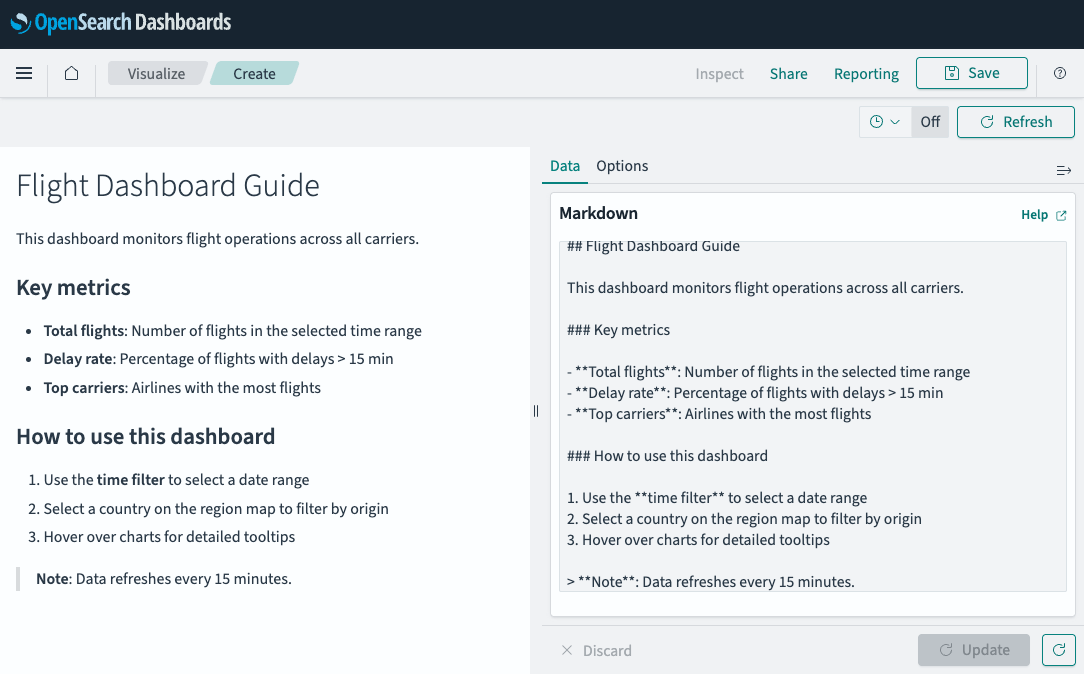
- In the Markdown text box on the Data tab, enter your Markdown content.
- Select Update to preview the rendered output, as shown in the following image.
- (Optional) Select the Options tab to adjust the base font size or enable Open links in new tab.
Configuring a Markdown visualization
The following settings are available on the Options tab.
Options tab
| Setting | Description |
|---|---|
| Font size | Controls the base font size of the rendered text. |
| Open links in new tab | When enabled, links in the Markdown open in a new browser tab. |
Next steps
- To choose a different visualization type, see Visualization types.
- To add this visualization to a dashboard, see Creating dashboards.