Heat maps
A heat map displays values represented as a color or saturation gradient on a two-dimensional grid, effectively rendering a three-dimensional data display. The X and Y dimensions can be the same, as in a spatial heat map, or different—for example, months against years in a record of average temperature at a location (thus separating the cyclic and trend data for the site).
When to use heat maps
Use heat maps to reveal clusters, correlation strengths, and anomalies within multidimensional datasets. They make patterns visible that would be difficult to see in tabular format or in multiple two-dimensional plots.
Creating a heat map
The examples on this page use the Sample flight data dataset. Before you begin, complete the prerequisites.
To create a heat map, follow these steps:
- In the New Visualization dialog, select Heat Map, then select your index pattern (for example, opensearch_dashboards_sample_data_flights).
- Under Metrics, expand Value Count and set Aggregation to Count.
- Under Buckets, select Add > X-axis.
- Set Aggregation to Terms, Field to OriginWeather, and Size to
8. - Select Update.
- Under Buckets, select Add > Y-axis.
- Set Sub aggregation to Terms, Field to DestWeather, and Size to
8. - Select Update.
Customizing the display
- Select the Options tab.
- In Heatmap settings, set Color schema to Greys and Number of colors to
8. - In Labels, enable Show labels.
-
Select Update.
The heat map shows average flight delay mapped to origin and destination weather combinations, as shown in the following image.
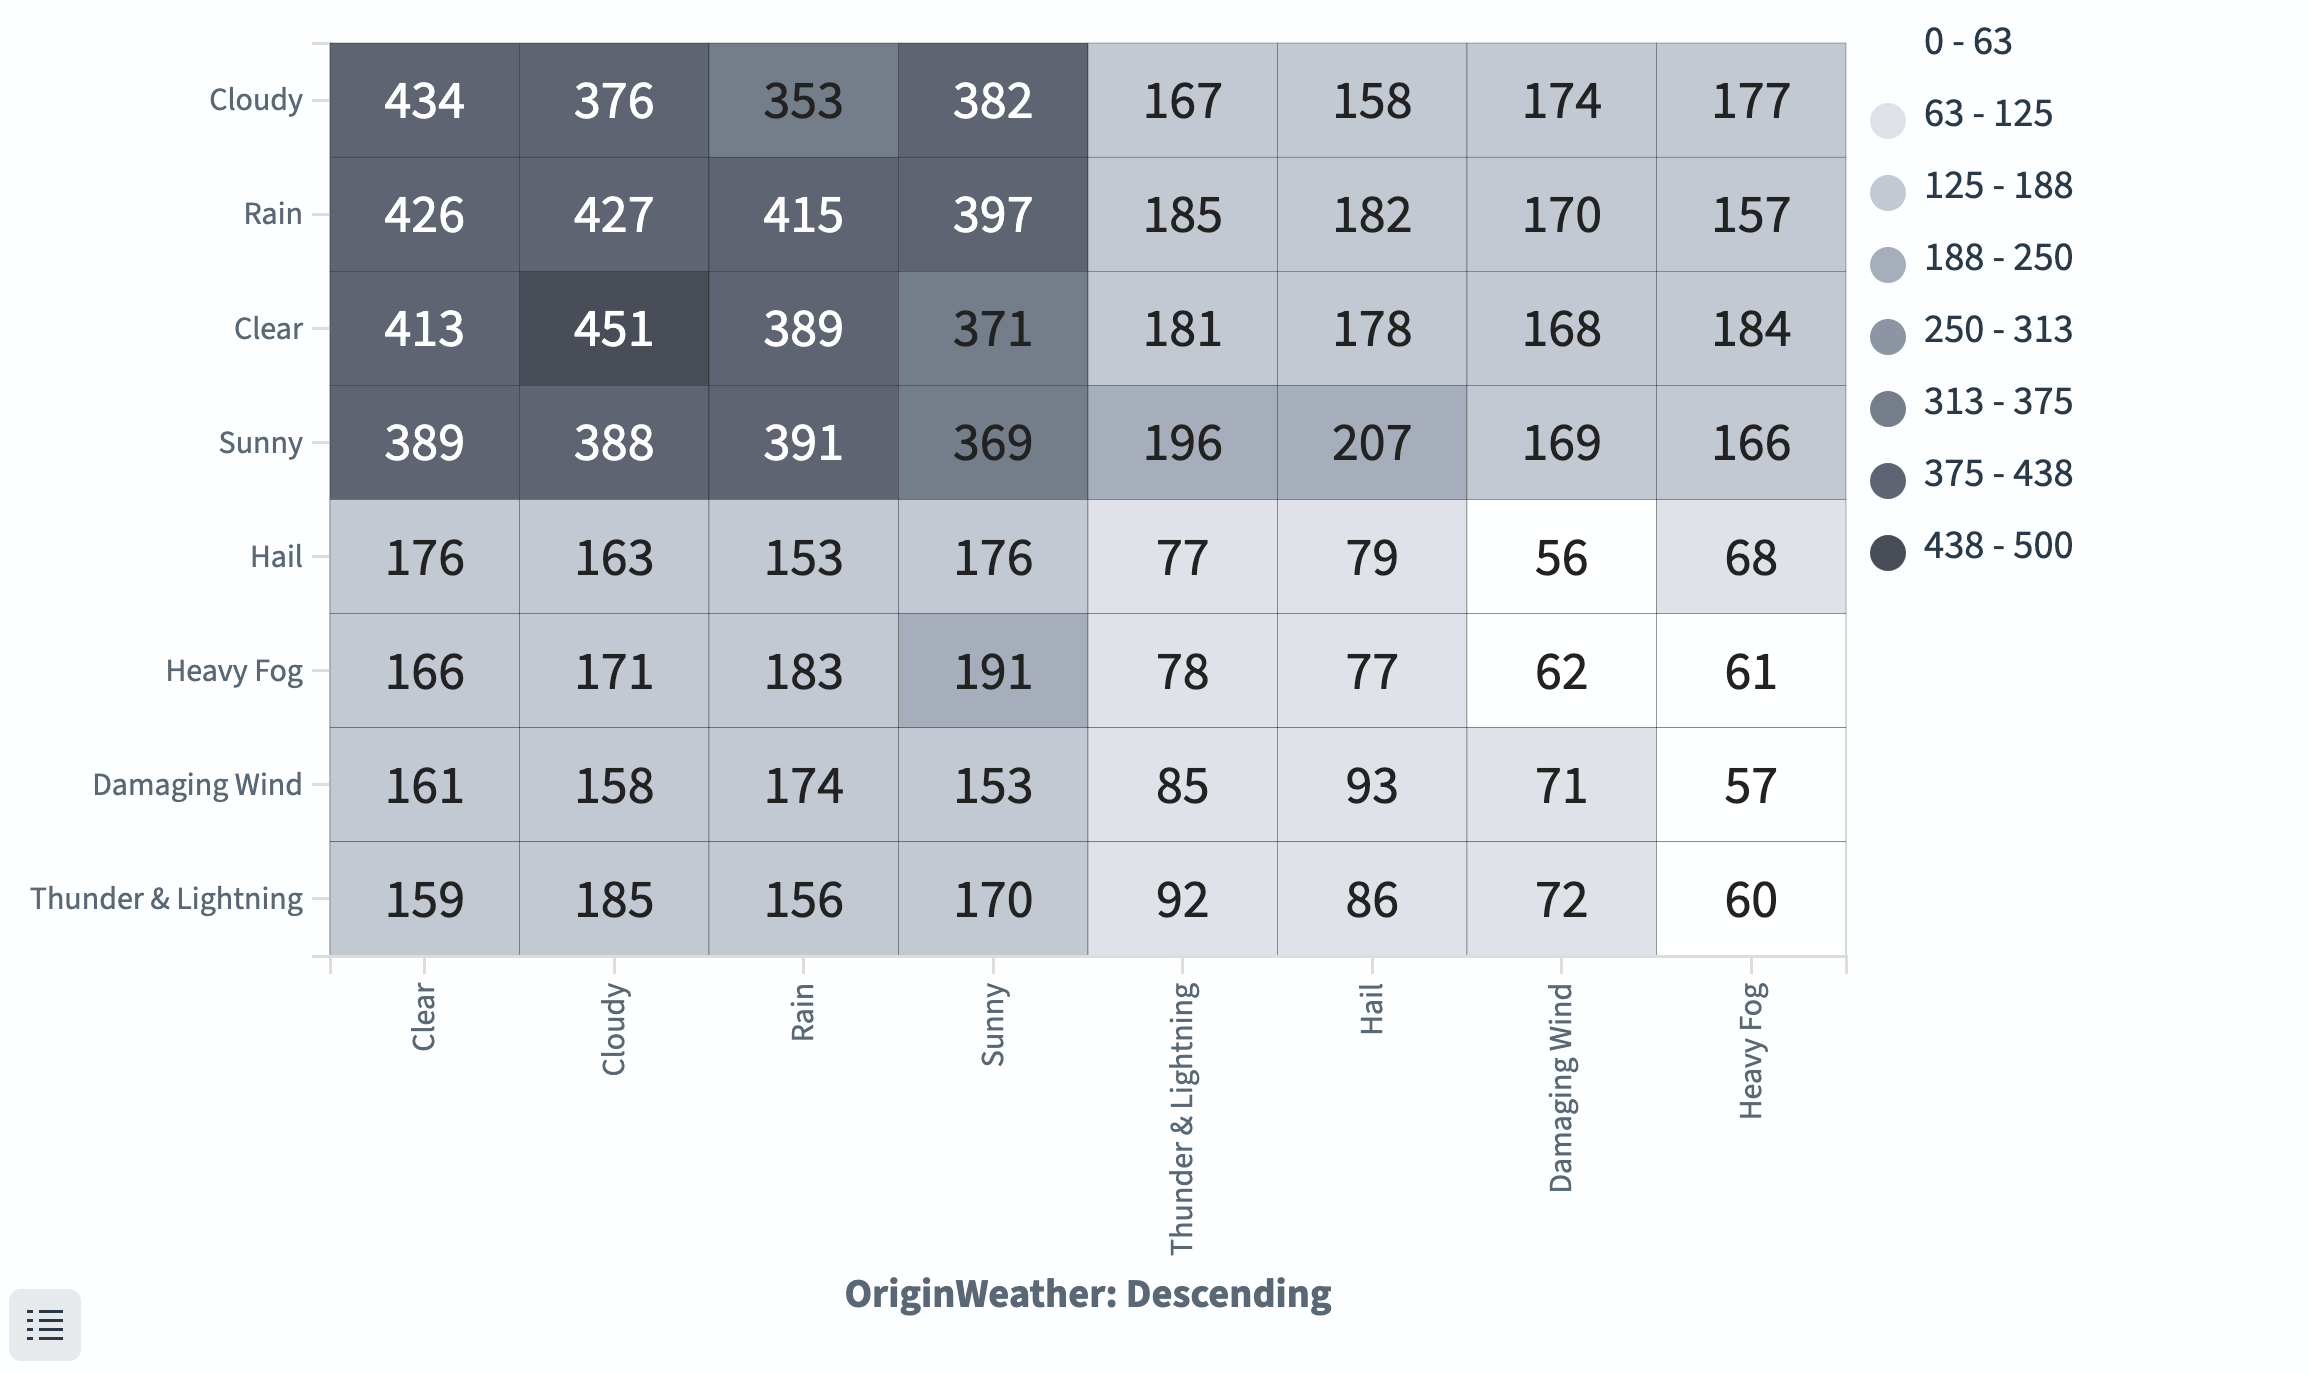
Note the following:
- The heat map data is organized into four quadrants, corresponding to the four combinations of “good” (Cloudy, Rain, Clear, Sunny) and “bad” (Hail, Heavy Fog, Damaging Wind, Thunder & Lightning) weather conditions at the destination and origin.
- The longest delays occurred when the weather was good at both the origin and destination. The shortest delays occurred when the weather was bad at both locations.
Filtering with split chart
You can filter the data using the filter tool, but if the visualization is in a dashboard this filters the data for other visualizations as well. The following procedure limits the data only for this visualization.
To limit the heat map to specific conditions (for example, only cancelled flights):
- Under Buckets, select Add > Split chart > Rows.
- Set Sub aggregation to Filters.
-
In the Filter 1 box, enter
Cancelled: true.The filter terms are case-sensitive.
-
Select Update.
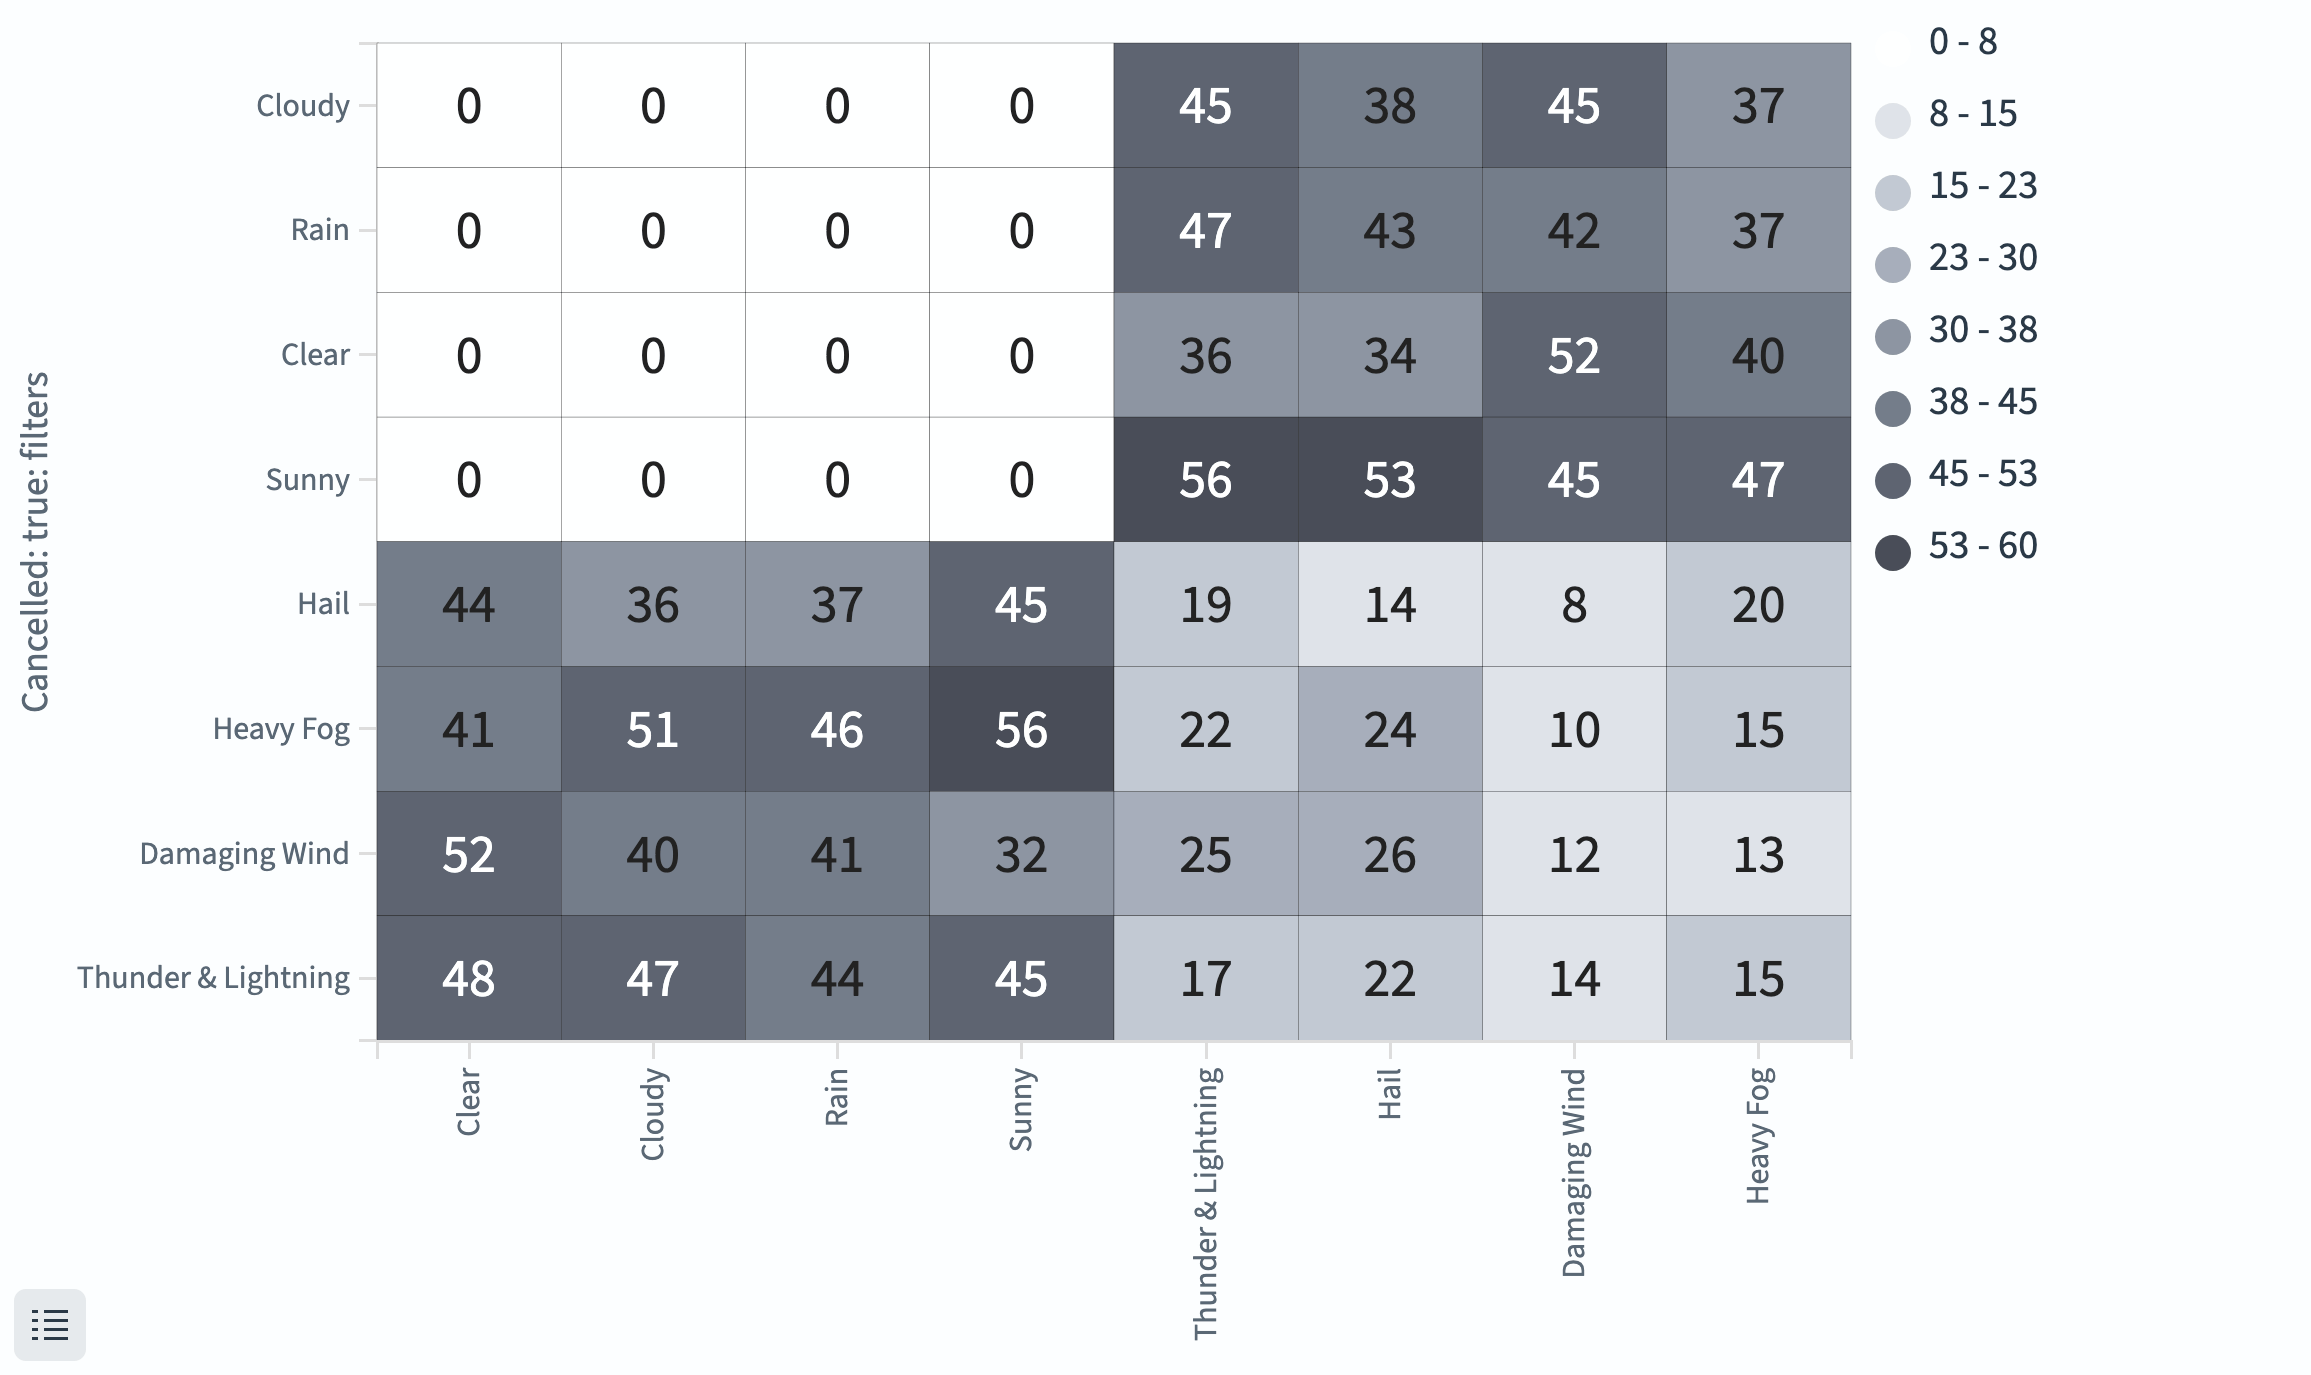
The heat map now shows only cancelled flights. It shows that no cancellations occurred when the weather was good at both ends of the flight, as shown in the following image.
Configuring a heat map
For information about general visualization configuration, see Configuring visualizations.
Options tab
| Setting | Description |
|---|---|
| Color schema | The color palette for the heat map (for example, Greens, Blues, Greys, Yellow to Orange). |
| Reverse schema | Inverts the color mapping. |
| Number of colors | The number of discrete color bins. |
| Show labels | Displays values inside each cell. |
| Percentage mode | Normalizes values between 0 and 1. |
Next steps
- To choose a different visualization type, see Visualization types.
- To add this visualization to a dashboard, see Creating dashboards.