Building data visualizations
OpenSearch Dashboards provides two approaches for creating data visualizations: building visualizations visually and building visualizations using queries. Both produce charts that you can save and add to dashboards.
Choosing a visualization approach
When you select Create new in a dashboard (or Create new visualization in the Visualize app), a dialog presents the available visualization types. The first option, Add visualization, opens the query-based visualization editor. All other options (such as Area, Line, or Pie) open the visual point-and-click tool.
The following table compares the two approaches. Italicized visualization types are unique to that approach.
If you’re getting started, use the Visualize application to build visualizations visually—it’s available by default in all installations. Building visualizations using queries requires additional configuration and PPL or PromQL knowledge.
| Creating visualizations in the Visualize application | Creating visualizations using queries | |
|---|---|---|
| Entry point | In the Create new dialog, select a chart type (Area, Line, Pie, and others) | In the Create new dialog, select Add visualization |
| Configuration | Configure metrics and buckets using point-and-click panels. Use DQL in the search bar to filter data. | Write Piped Processing Language (PPL) or Prometheus Query Language (PromQL) queries to define the data. The editor automatically suggests a chart type. |
| Visualization types | - Area - Bar - Coordinate map - Data table - Gauge - Heatmap - Line - Metric - Pie - Region map - Tag cloud - Timeline - TSVB - Vega - VisBuilder | - Area - Bar - Bar gauge - Gauge - Heatmap - Line - Pie - Scatter - State timeline |
| Prerequisites | None (available by default in all installations) | Requires workspace.enabled: true and explore.enabled: true in opensearch_dashboards.yml. If these settings are not enabled by your administrator, the visualization editor is not available. |
| Best for | Aggregation-based analysis without writing queries | Query-driven exploration where you need precise control over data shaping |
| Application | Visualize application | Visualization editor |
Creating visualizations in the Visualize application
The Visualize application uses a point-and-click interface to build visualizations from aggregations. Select a chart type, choose an index pattern, configure metrics and buckets, and render the result, as shown in the following image. Use the DQL search bar to filter the underlying data.
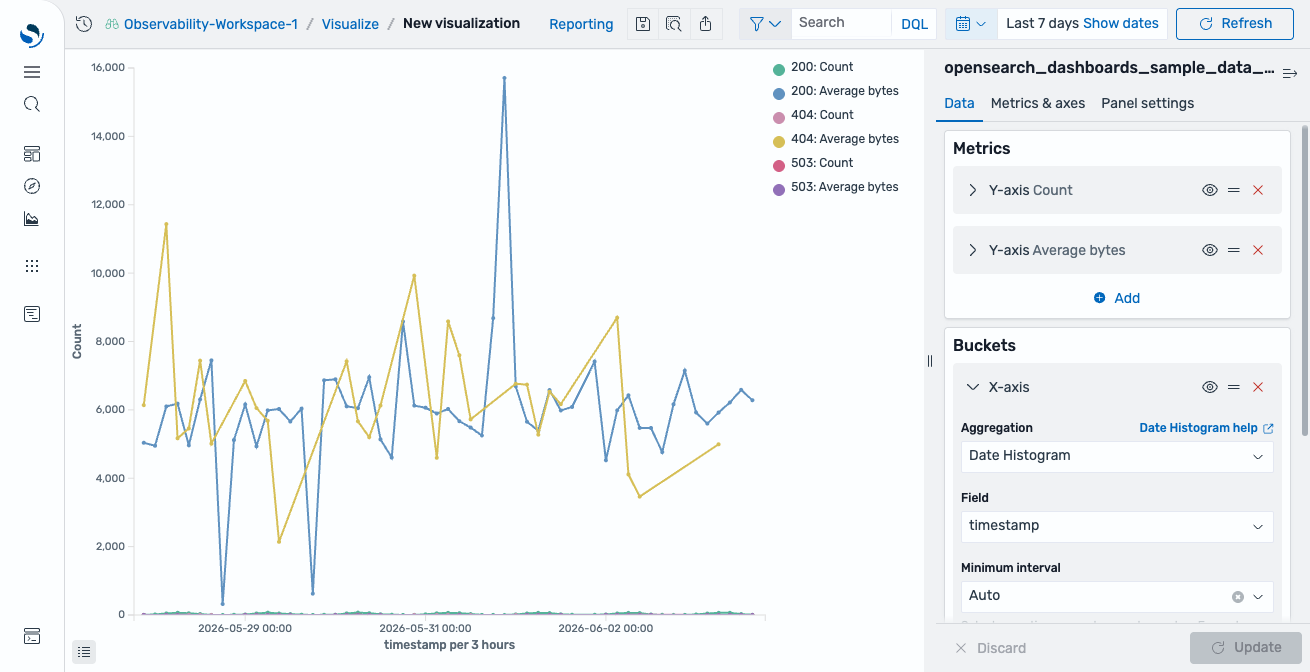
For more information, see Creating visualizations in the Visualize application.
Creating visualizations using queries
The visualization editor lets you write PPL or PromQL queries and map query results directly to chart fields. The editor automatically suggests a chart type based on the shape of your query results and maps fields to axes, as shown in the following image. This approach supports dashboard variables for interactive filtering.
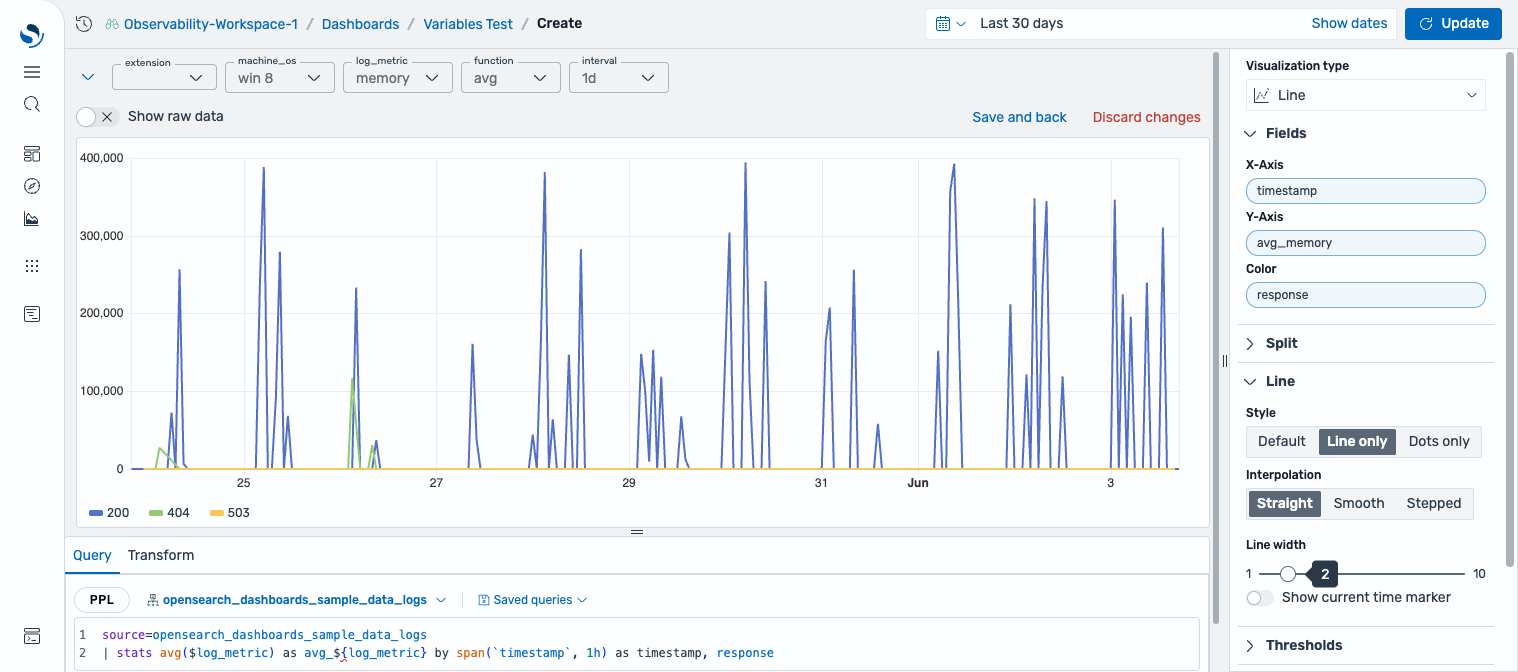
For more information, see Creating visualizations using queries.