Vega visualization
Vega and Vega-Lite are open-source, declarative language visualization tools that you can use to create custom data visualizations with your OpenSearch data and Vega data. These tools are ideal for advanced users comfortable with writing OpenSearch queries directly. You define data sources inline within your Vega specification.
When to use Vega visualizations
Use Vega visualizations when you need visualization types or analytical capabilities not available in standard OpenSearch visualization types, including advanced statistical analysis, custom interactive behaviors, and specialized analytical techniques.
Enabling Vega visualizations
Vega visualizations are enabled by default. Write your Vega specifications in JSON or Hjson format. You can specify one or more OpenSearch queries within a specification.
To disable Vega visualizations, set vis_type_vega.enabled to false in your opensearch_dashboards.yml file.
Creating a Vega visualization
The examples on this page use the Sample e-commerce data dataset. To learn about adding sample datasets, see Adding sample data.
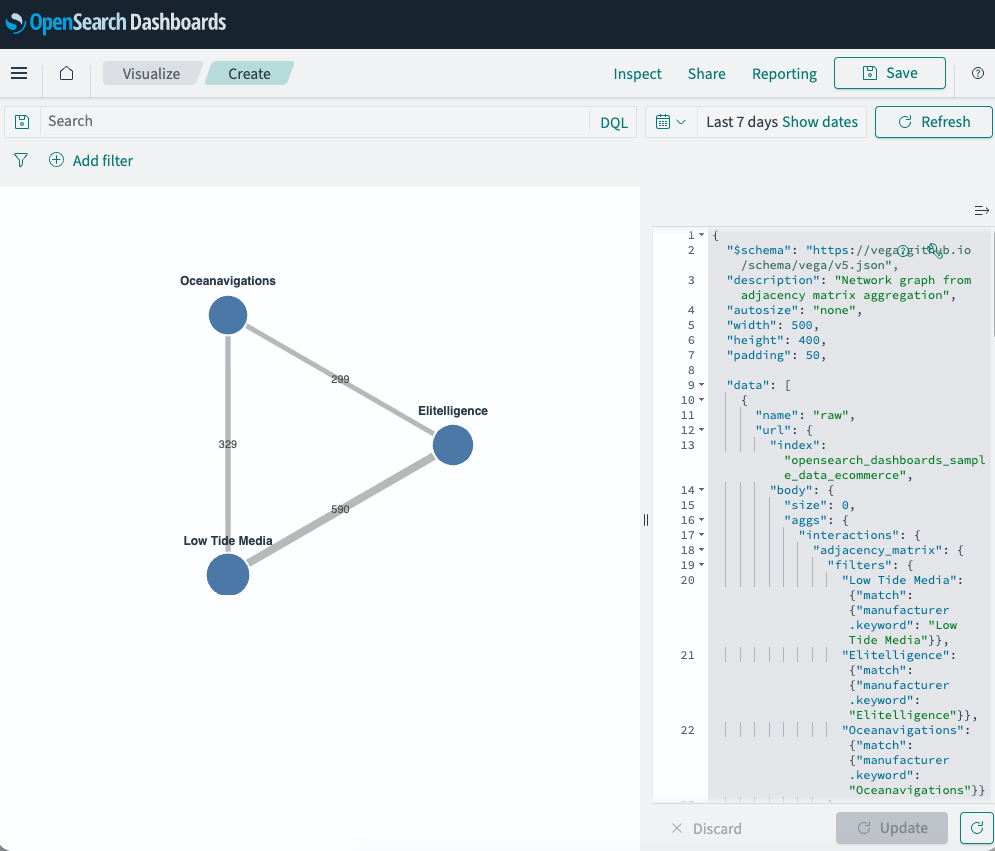
The following example creates a network graph that visualizes relationships between product manufacturers in the sample e-commerce dataset. It uses the adjacency_matrix aggregation to determine how frequently products from different manufacturers appear together in the same orders.
To create a Vega visualization for this aggregation, follow these steps:
- From the menu on the left, select Visualize.
- Select Create Visualization and then select Vega.
- Replace the default spec with the following and then select Update:
{
  "$schema": "https://vega.github.io/schema/vega/v5.json",
  "description": "Network graph from adjacency matrix aggregation",
  "autosize": "none",
  "width": 500,
  "height": 400,
  "padding": 50,

  "data": [
    {
      "name": "raw",
      "url": {
        "index": "opensearch_dashboards_sample_data_ecommerce",
        "body": {
          "size": 0,
          "aggs": {
            "interactions": {
              "adjacency_matrix": {
                "filters": {
                  "Low Tide Media": {"match": {"manufacturer.keyword": "Low Tide Media"}},
                  "Elitelligence": {"match": {"manufacturer.keyword": "Elitelligence"}},
                  "Oceanavigations": {"match": {"manufacturer.keyword": "Oceanavigations"}}
                }
              }
            }
          }
        }
      },
      "format": {"property": "aggregations.interactions.buckets"}
    },
    {
      "name": "nodes",
      "source": "raw",
      "transform": [
        {"type": "filter", "expr": "indexof(datum.key, '&') === -1"},
        {"type": "window", "ops": ["row_number"], "as": ["index"]},
        {"type": "formula", "as": "x", "expr": "250 + 150 * cos(2 * PI * (datum.index - 1) / 3)"},
        {"type": "formula", "as": "y", "expr": "200 + 150 * sin(2 * PI * (datum.index - 1) / 3)"}
      ]
    },
    {
      "name": "edges",
      "source": "raw",
      "transform": [
        {"type": "filter", "expr": "indexof(datum.key, '&') !== -1"},
        {"type": "formula", "as": "source", "expr": "split(datum.key, '&')[0]"},
        {"type": "formula", "as": "target", "expr": "split(datum.key, '&')[1]"},
        {"type": "lookup", "from": "nodes", "key": "key", "fields": ["source"], "as": ["sourceNode"]},
        {"type": "lookup", "from": "nodes", "key": "key", "fields": ["target"], "as": ["targetNode"]}
      ]
    }
  ],

  "scales": [
    {
      "name": "nodeSize",
      "type": "linear",
      "domain": {"data": "nodes", "field": "doc_count"},
      "range": [400, 2000]
    },
    {
      "name": "linkWidth",
      "type": "linear",
      "domain": {"data": "edges", "field": "doc_count"},
      "range": [2, 8]
    }
  ],

  "marks": [
    {
      "type": "rule",
      "from": {"data": "edges"},
      "encode": {
        "enter": {
          "x": {"field": "sourceNode.x"},
          "y": {"field": "sourceNode.y"},
          "x2": {"field": "targetNode.x"},
          "y2": {"field": "targetNode.y"},
          "stroke": {"value": "#888"},
          "strokeWidth": {"scale": "linkWidth", "field": "doc_count"},
          "strokeOpacity": {"value": 0.6}
        }
      }
    },
    {
      "type": "text",
      "from": {"data": "edges"},
      "encode": {
        "enter": {
          "x": {"signal": "(datum.sourceNode.x + datum.targetNode.x) / 2"},
          "y": {"signal": "(datum.sourceNode.y + datum.targetNode.y) / 2"},
          "text": {"signal": "datum.doc_count"},
          "align": {"value": "center"},
          "baseline": {"value": "middle"},
          "fontSize": {"value": 11},
          "fill": {"value": "#555"}
        }
      }
    },
    {
      "type": "symbol",
      "from": {"data": "nodes"},
      "encode": {
        "enter": {
          "x": {"field": "x"},
          "y": {"field": "y"},
          "size": {"scale": "nodeSize", "field": "doc_count"},
          "fill": {"value": "#4C78A8"},
          "stroke": {"value": "#fff"},
          "strokeWidth": {"value": 2},
          "tooltip": {"signal": "datum.key + ': ' + datum.doc_count + ' docs'"}
        }
      }
    },
    {
      "type": "text",
      "from": {"data": "nodes"},
      "encode": {
        "enter": {
          "x": {"field": "x"},
          "y": {"field": "y"},
          "dy": {"value": -30},
          "text": {"field": "key"},
          "align": {"value": "center"},
          "fontSize": {"value": 12},
          "fontWeight": {"value": "bold"}
        }
      }
    }
  ]
}
The following image shows the resulting network graph. Node size represents the document count for each manufacturer, and edge thickness represents the number of orders containing products from both manufacturers.
Creating Vega visualizations from multiple data sources
Introduced 2.13
Before proceeding, ensure that the following configuration settings are enabled in the config/opensearch_dashboards.yaml file. For configuration details, refer to the vis_type_vega README.
data_source.enabled: true
vis_type_vega.enabled: true
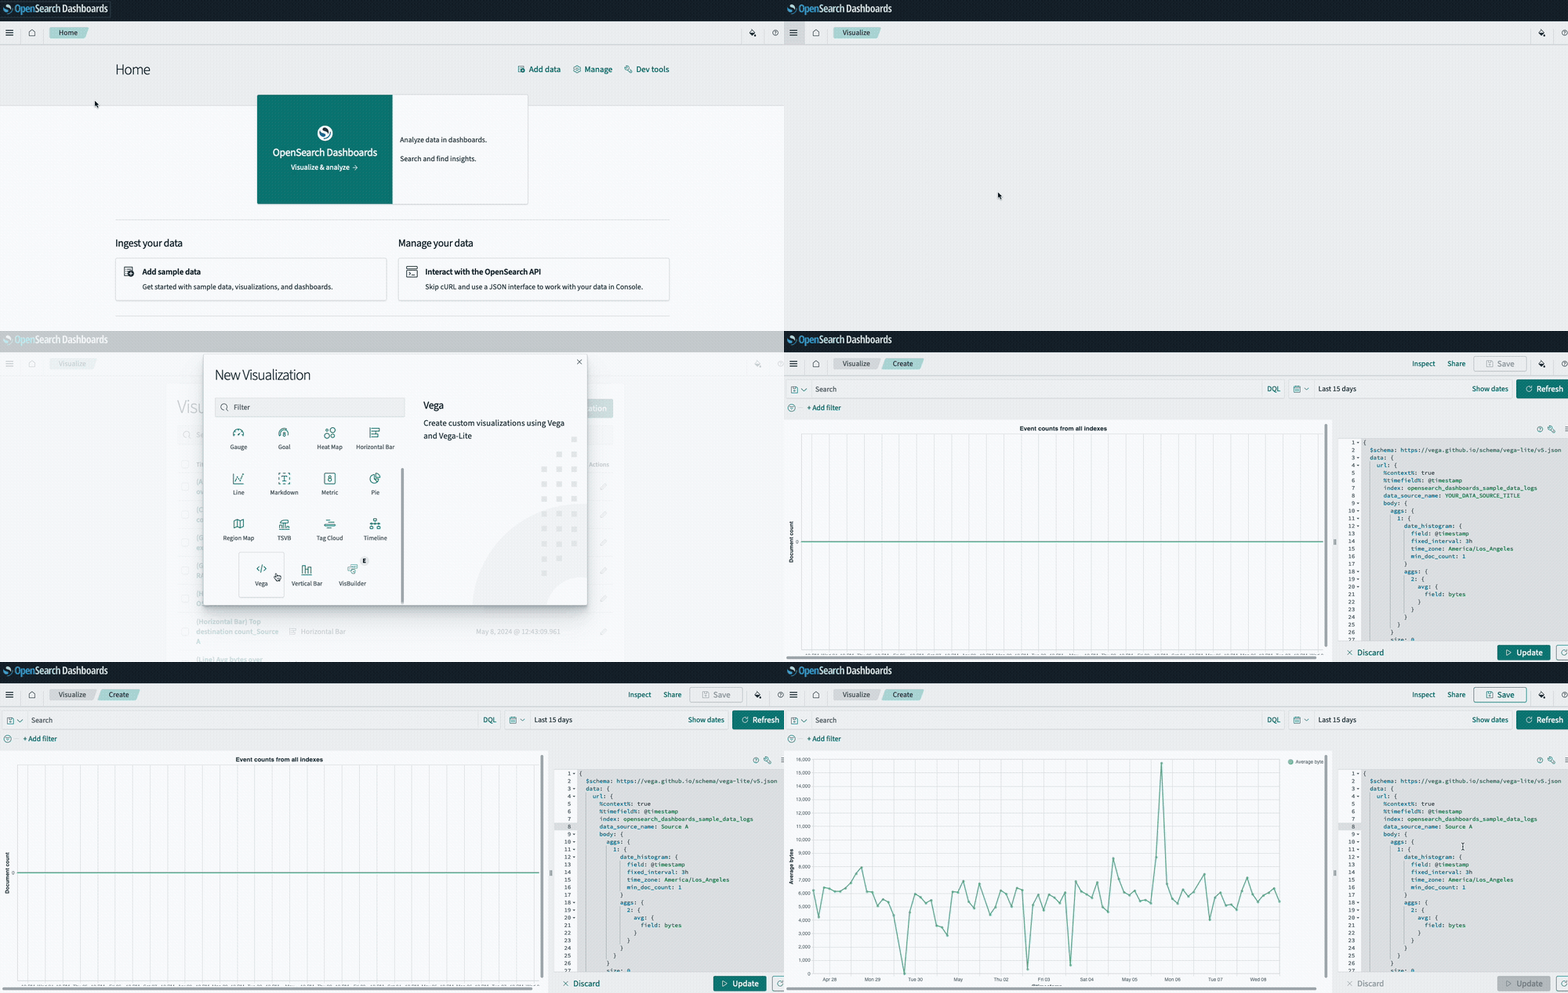
After you have configured multiple data sources in OpenSearch Dashboards, you can use Vega to query those data sources. The following GIF shows the process of creating Vega visualizations in OpenSearch Dashboards.
Step 1: Set up and connect data sources
Open OpenSearch Dashboards and follow these steps:
- Select Dashboards Management from the menu on the left.
- Select Data sources and then select the Create data source button.
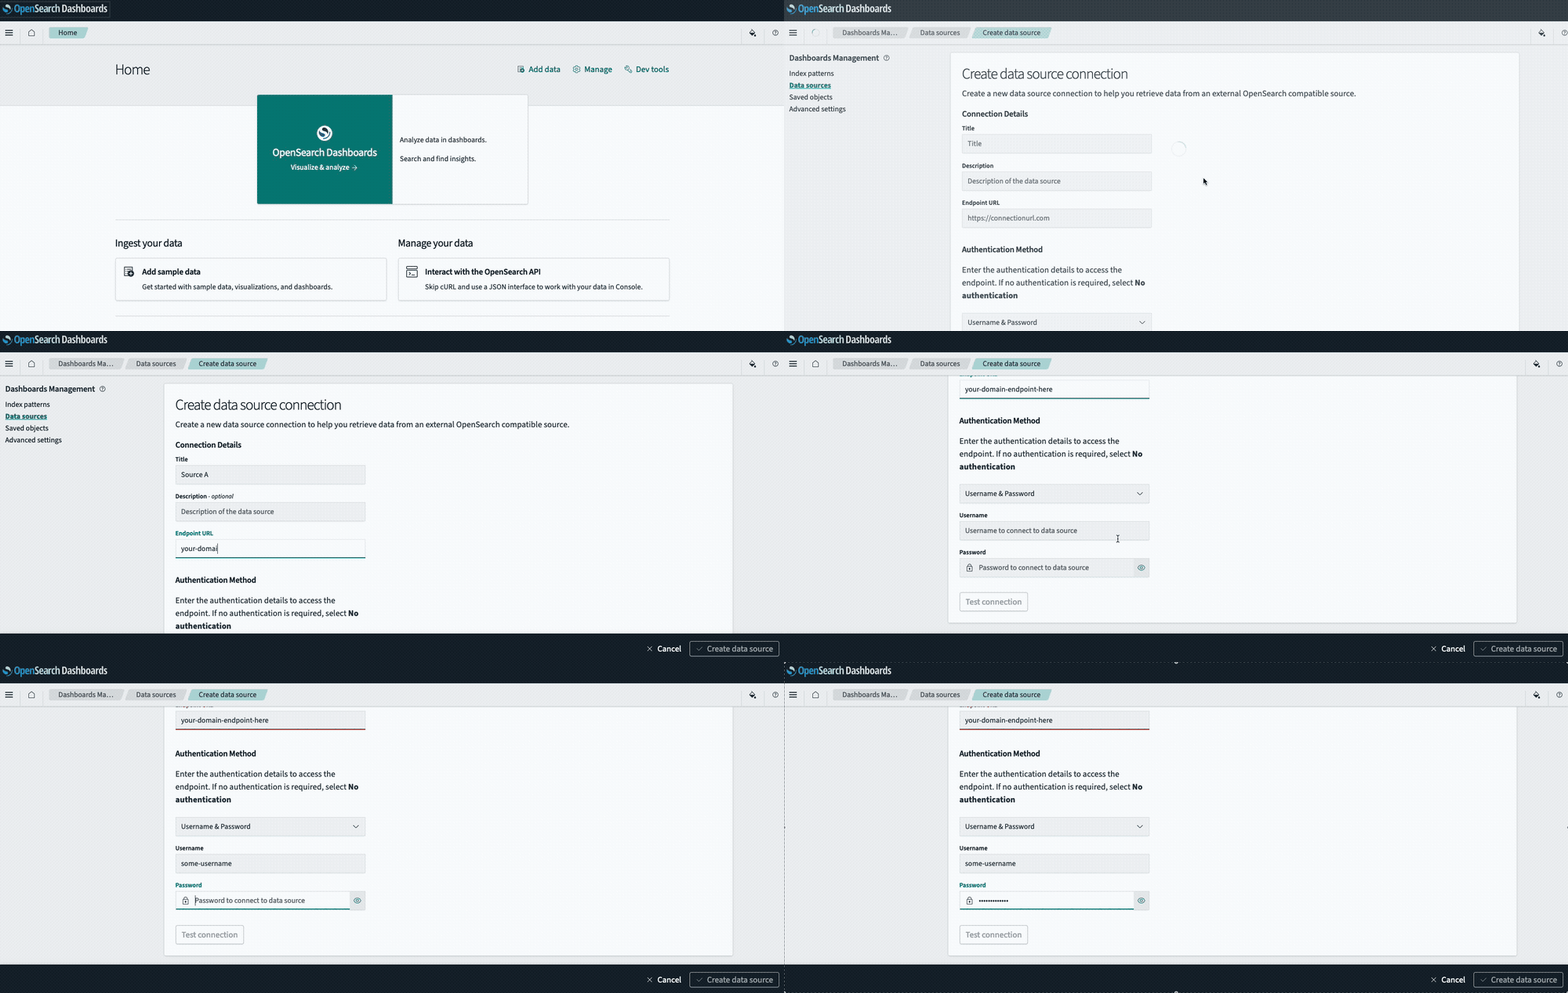
- On the Create data source page, enter the connection details and endpoint URL, as shown in the following GIF.
- On the Home page, select Add sample data. Under Data source, select your newly created data source, and then select the Add data button for the Sample web logs dataset.
The following GIF shows the steps required for setting up and connecting a data source.
Step 2: Create the visualization
- From the menu on the left, select Visualize.
- On the Visualizations page, select Create Visualization and then select Vega in the pop-up window.
Step 3: Add the Vega specification
By default, queries use data from the local cluster. You can assign individual data_source_name values to each OpenSearch query in your Vega specification. This allows you to query multiple indexes across different data sources in a single visualization.
- Verify that the data source you created is specified under
data_source_name. Alternatively, in your Vega specification, add thedata_source_namefield under theurlproperty to target a specific data source by name. - Copy the following Vega specification and then select the Update button in the lower-right corner. The visualization should appear.
{
  $schema: https://vega.github.io/schema/vega-lite/v5.json
  data: {
    url: {
      %context%: true
      %timefield%: @timestamp
      index: opensearch_dashboards_sample_data_logs
      data_source_name: YOUR_DATA_SOURCE_TITLE
      body: {
        aggs: {
          1: {
            date_histogram: {
              field: @timestamp
              fixed_interval: 3h
              time_zone: America/Los_Angeles
              min_doc_count: 1
            }
            aggs: {
              2: {
                avg: {
                  field: bytes
                }
              }
            }
          }
        }
        size: 0
      }
    }
    format: {
      property: aggregations.1.buckets
    }
  }
  transform: [
    {
      calculate: datum.key
      as: timestamp
    }
    {
      calculate: datum[2].value
      as: bytes
    }
  ]
  layer: [
    {
      mark: {
        type: line
      }
    }
    {
      mark: {
        type: circle
        tooltip: true
      }
    }
  ]
  encoding: {
    x: {
      field: timestamp
      type: temporal
      axis: {
        title: @timestamp
      }
    }
    y: {
      field: bytes
      type: quantitative
      axis: {
        title: Average bytes
      }
    }
    color: {
      datum: Average bytes
      type: nominal
    }
  }
}
Additional resources
The following resources provide additional information about Vega visualizations in OpenSearch Dashboards:
Next steps
- To choose a different visualization type, see Visualization types.
- To add this visualization to a dashboard, see Creating dashboards.