Explore the Dashboards application
The Dashboards application lets you combine multiple visualizations into a single page for monitoring and analysis.
With Dashboards, you can:
- Display multiple data visualizations in a single view.
- Build dynamic dashboards.
- Create and share reports.
- Embed analytics to differentiate your applications.
Prerequisites
The examples on this page use the Sample flight data dataset that is already installed in OpenSearch Playground.
If you’re using a local installation of OpenSearch Dashboards and haven’t added sample data yet, see Prepare your data.
Try it: Explore a prebuilt dashboard
-
From the navigation panel, select OpenSearch Dashboards > Dashboards. The panel displays a list of existing dashboards.
-
In the search toolbar, search for and select [Flights] Global Flight Dashboard.
The panel displays a dashboard preloaded with visualizations, including charts, maps, and data tables.
-
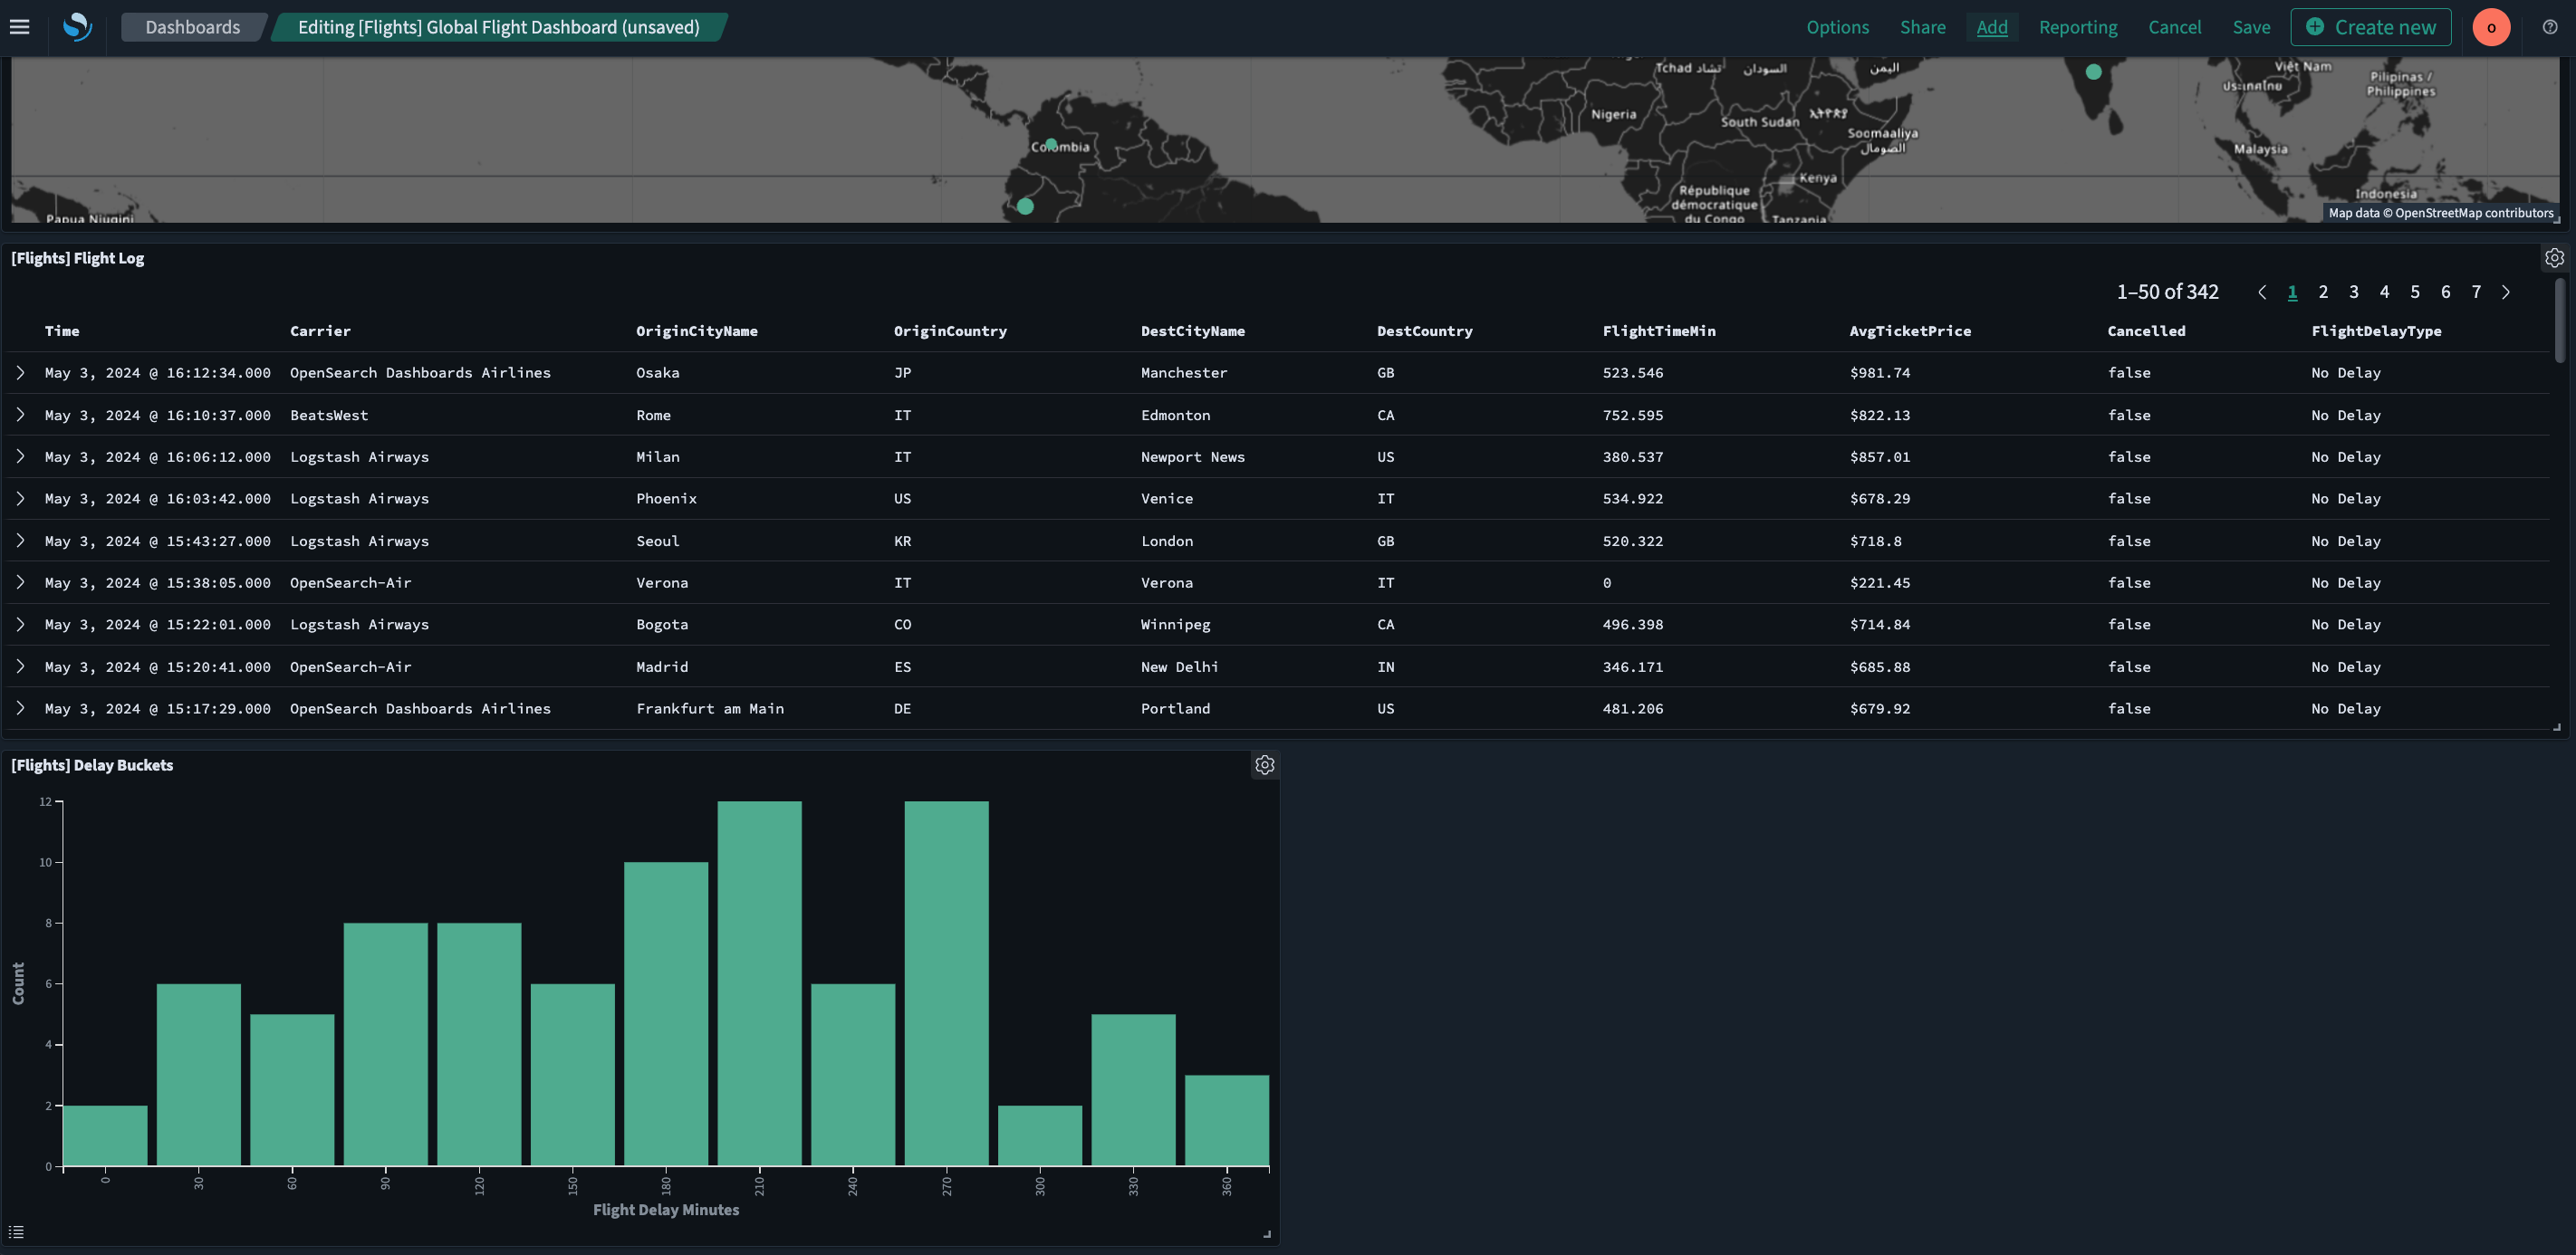
To add other panels to the dashboard, select the Edit button and choose Add from the toolbar.
-
In the search toolbar in the Add panels window, enter
flights. -
From the narrowed list, select [Flights] Delay Buckets.
-
Select
 (cross) to exit the confirmation dialog.
 -
Select
(cross) to exit the Add panels window. -
Scroll down to confirm that the newly added panel is now displayed as the last panel on the dashboard.
The resulting view is shown in the following image.
Adding your own visualization
If you completed the Explore the Visualize application tutorial and saved the Flight count over time visualization, you can add it to this dashboard:
- Select Add from the toolbar.
- In the search toolbar, enter
Flight count over time. - Select the visualization from the list.
This step requires a local installation. Saving visualizations is not available in the OpenSearch Playground.
Filtering data in Dashboards
You can interact with visualizations to filter data.
Using the [Flights] Global Flight Dashboard dashboard, follow these steps to filter the sample flight data:
-
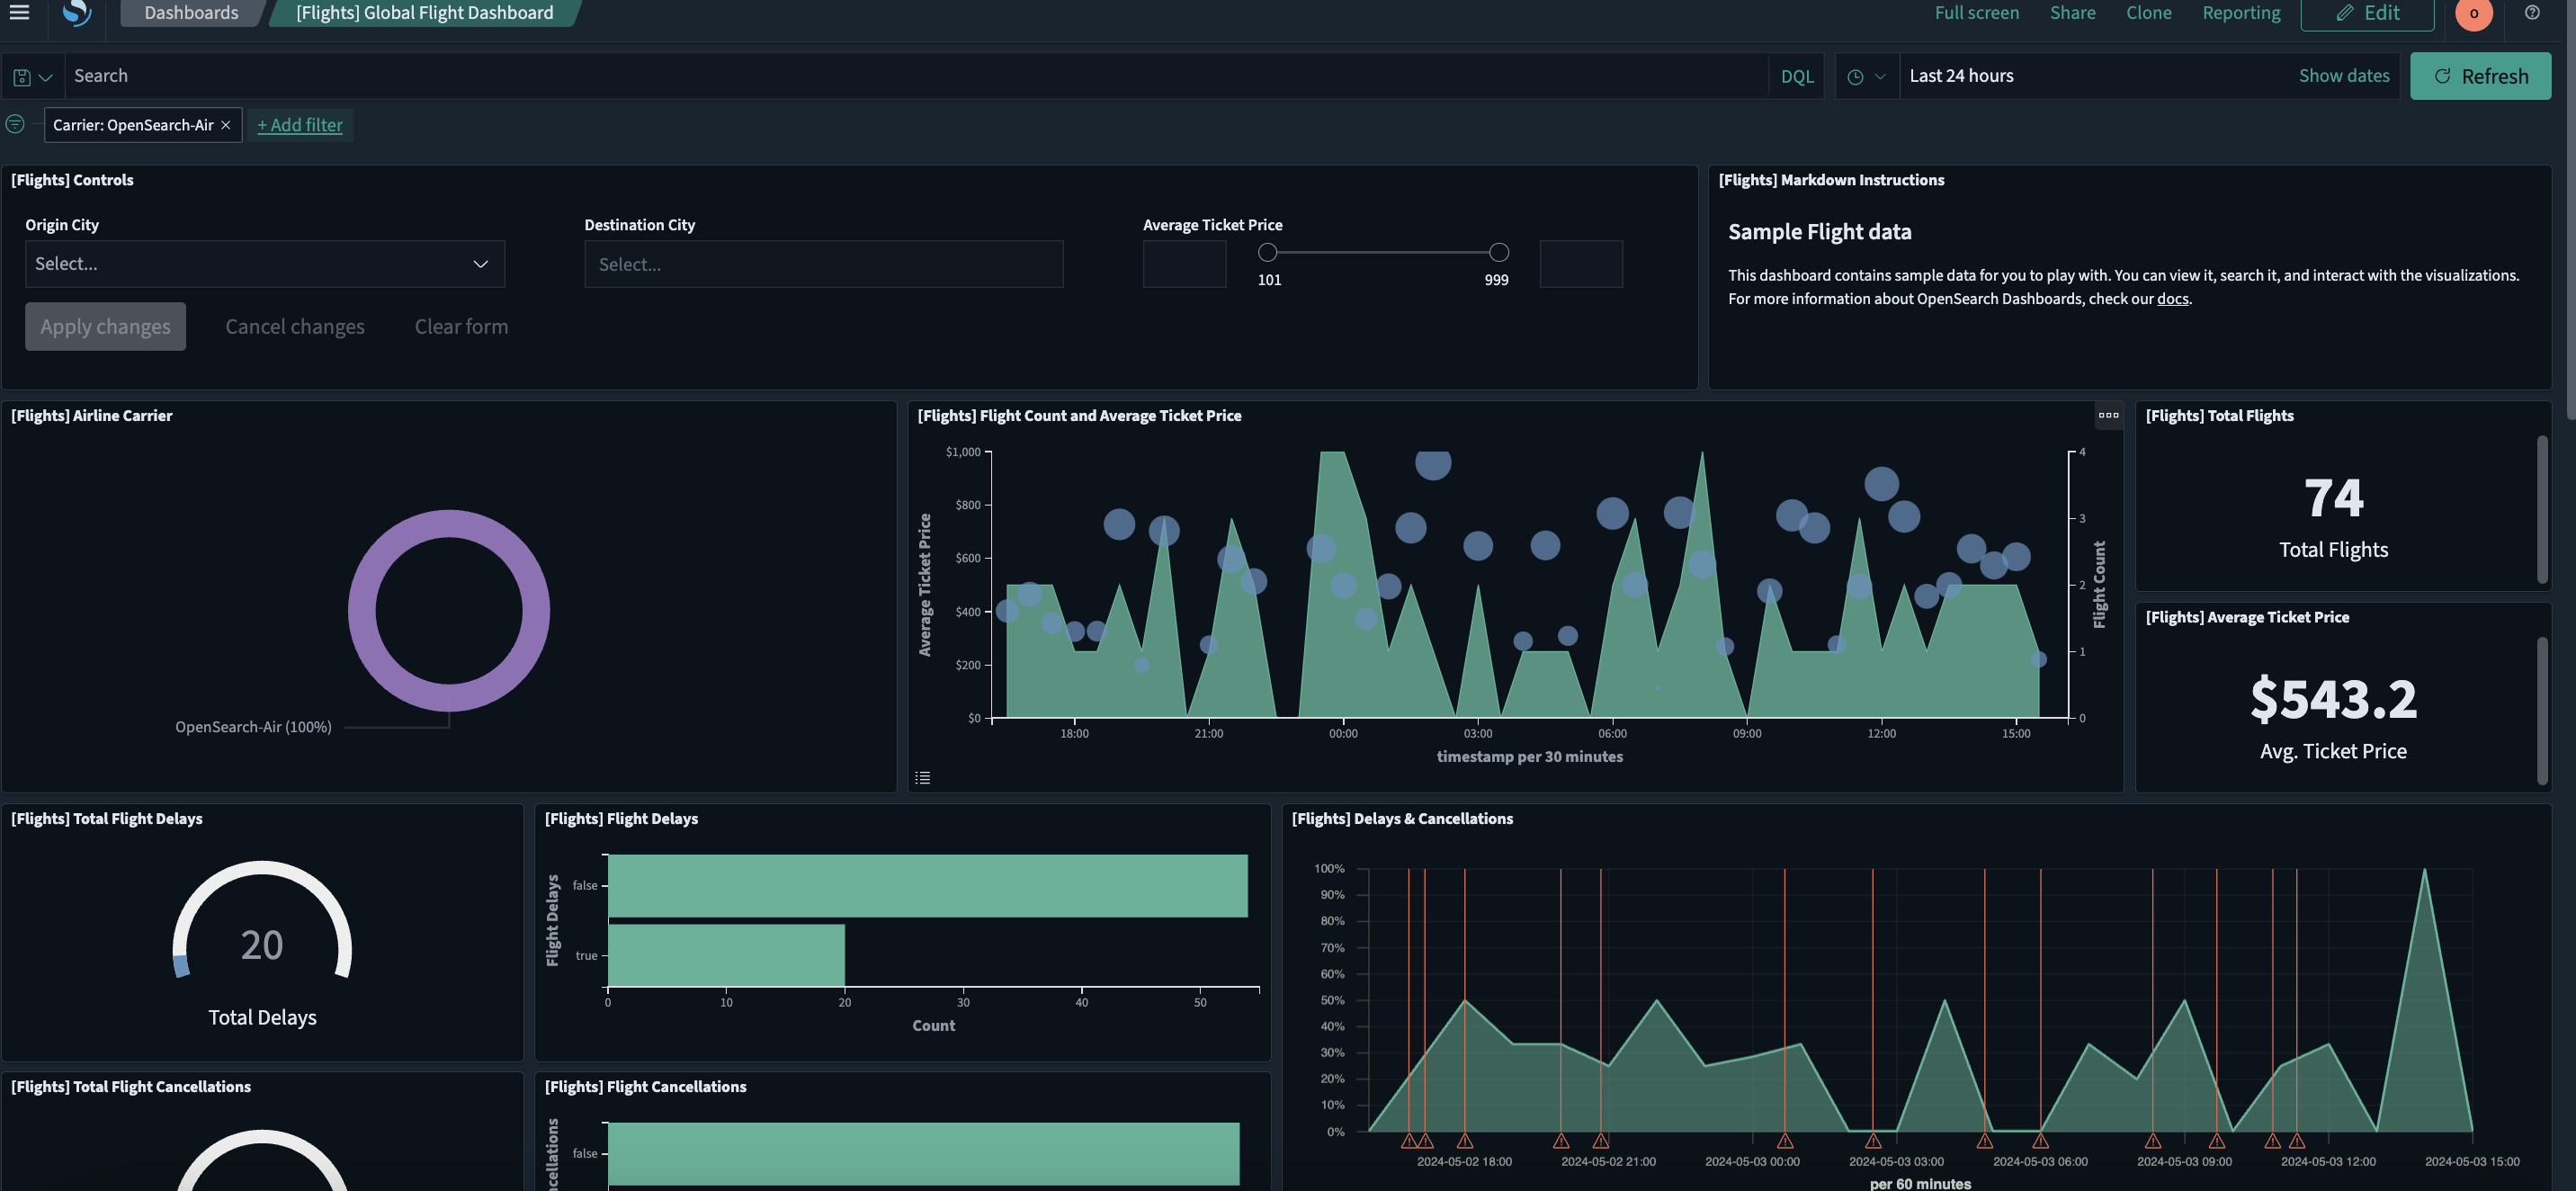
On the [Flights] Airline Carrier panel, select OpenSearch-Air.
The dashboard updates automatically, adding the filter
Carrier: OpenSearch-Airto the upper-left filter bar, as shown in the following image.
-
Select Save to save the dashboard.
Alternatively, you can use the dashboard toolbar to apply filters:
-
Select
(cross) in the Carrier: OpenSearch-Airfilter in the filter bar to remove the filter. -
In the dashboard toolbar, select
 (plus) Add filter.
 -
From the Field, Operator, and Value dropdown lists, select Carrier, is, and OpenSearch-Air, respectively.
-
Select Save.
The dashboard updates automatically.
The resulting view is shown in the following image.
Further reading
- For the full Dashboards reference, see Creating dashboards.
Next steps
- Learn how to run API queries in Run queries in the Dev Tools console.