Dashboard variables
Introduced 3.7
Dashboard variables are reusable values that you can reference in visualization editor queries. Use variables for filters, metrics, dimensions, intervals, fields, aggregations, and any other query parameter, eliminating the need to manually edit PPL or PromQL queries when switching between data views.
Dashboard variables are available in Observability workspaces only. To use dashboard variables, create an Observability workspace if you don’t already have one. For more information, see Workspace for OpenSearch Dashboards.
Use dashboard variables to:
- Change query parameters without editing visualizations.
- Define values once and reference them across multiple visualizations.
- Automatically update visualizations when variable values change.
- Create cascading filters with dependent variables.
- Dynamically control grouping, aggregation, and time intervals.
Variable types
OpenSearch Dashboards supports two types of variables:
-
Query variables: Options are dynamically fetched from a data source using a Piped Processing Language (PPL) or Prometheus Query Language (PromQL) query. Use query variables when values change over time or depend on underlying data, such as service names from logs or available regions from metrics.
-
Custom variables: Options are manually defined as a static list. Use custom variables for predefined categories like environment types (
dev,staging,prod) or fixed status codes.
Variable syntax
You can reference variables in queries using $variableName or ${variableName} syntax:
source=logs | where service='${service}' | stats count() by region
When you change a variable’s value in a dashboard, all visualizations referencing that variable automatically refresh using the new value.
Enabling dashboard variables
In your opensearch_dashboards.yml file, configure the following settings:
workspace.enabled: true
explore.enabled: true
Restart OpenSearch Dashboards for the changes to take effect.
Creating and using dashboard variables
The following tutorial uses the OpenSearch Dashboards sample web logs dataset to create a variable and use it in a visualization.
Step 1: Create a workspace
- Navigate to the OpenSearch Dashboards home page.
- Select Create workspace.
- Enter a workspace name (for example,
My Observability). - Under Use case, select Observability.
- Select Create workspace.
For more information, see Create a workspace.
Step 2: Set up sample data
- In the workspace, navigate to Manage workspace > Sample data and select Add data for the web logs dataset.
- Create an index pattern for the sample data:
- Navigate to Manage workspace > Index patterns.
- Select Create index pattern.
- In the Index pattern name field, enter
opensearch_dashboards_sample_data_logs. - Select Next step.
- In the Time field dropdown, select
timestamp. - Select Create index pattern.
Step 3: Create a variable
- Select Dashboards in the left navigation.
- Select Create > Dashboard.
- Save the dashboard by entering a title (for example,
Log Analysis) and selecting Save. - At the top of the dashboard, select Add variable.
- Configure the following settings:
- Name:
extension - Type: Query
- Dataset: Select
opensearch_dashboards_sample_data_logs -
Options Query:
source=opensearch_dashboards_sample_data_logs | stats count() by extension | fields extension
- Name:
- Select Preview to verify the results. The preview should display values:
css,deb,gz,rpm, andzip. - Select Add variable to save.
The extension variable now appears at the top of the dashboard with a dropdown.
For more information, see Managing dashboard variables.
Step 4: Use the variable in a visualization
- In the dashboard, select Create new.
- Select Add visualization to open the visualization editor.
-
In the query editor, enter the following PPL query that references the
$extensionvariable:| where extension='$extension' | stats count() by response - In the
extensiondropdown at the top of the editor, select a value (for example,css). - Select Update to run the query.
The visualization displays the response code distribution filtered by the selected extension, as shown in the following image.
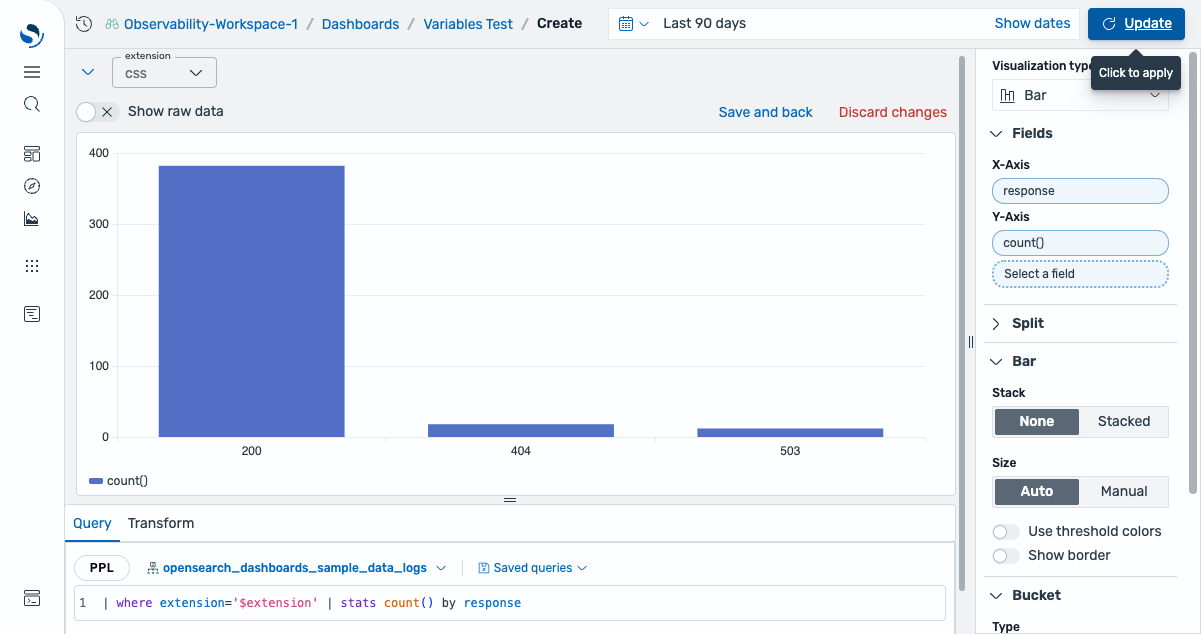
When you change the extension value in the dropdown, the visualization automatically updates to reflect the new selection.
If no results appear, expand the time range (for example, Last 90 days) using the time filter in the upper-right corner.
For more information, see Using dashboard variables.
Variable storage
Variables are stored as part of the dashboard saved object in OpenSearch. Each dashboard maintains its own set of variables independently.
The variablesJSON attribute in the dashboard saved object contains the variable configurations:
{
  type: "dashboard",
  id: "dashboard-id",
  attributes: {
    title: "My Dashboard",
    variablesJSON: "{\"variables\":[...]}"
  }
}
Variable configurations include the following components:
- Metadata (name, label, description, type).
- Options (query definition for query type or custom values for custom type).
- Settings (multi-select, “All” option, sort order, visibility).
- Current values (selected values for each variable).
Current variable values are also synchronized to the dashboard URL so that you can:
- Share dashboards with specific filter values preselected.
- Bookmark dashboards with desired variable states.
- Persist variable selections across page refreshes.
Related documentation
- Managing dashboard variables
- Using dashboard variables
- Creating visualizations using queries
- Workspace for OpenSearch Dashboards