Grok Debugger
Use the Grok Debugger tab in Dev Tools to build and test Grok patterns before using them in ingest pipelines. Grok patterns parse unstructured log data into structured fields. The Grok Debugger tests patterns against sample text you provide, so it doesn’t require any indexed data.
Testing a Grok pattern
To test a Grok pattern, follow these steps:
- Navigate to Dev Tools and select Grok Debugger at the top of the page.
-
In the Sample Log field, enter a sample log message. For example, enter the following Apache access log entry:
127.0.0.1 - alice [15/Mar/2026:10:32:41 -0700] "GET /products/1234 HTTP/1.1" 200 2326 -
In the Grok Pattern field, enter the pattern to test against the sample log:
%{IPORHOST:client_ip} - %{USER:user} \[%{HTTPDATE:timestamp}\] "%{WORD:method} %{URIPATHPARAM:request} HTTP/%{NUMBER:http_version}" %{NUMBER:status} %{NUMBER:bytes} - Select Simulate.
The Results pane displays Pattern matched and lists the extracted fields and their values, as shown in the following image.
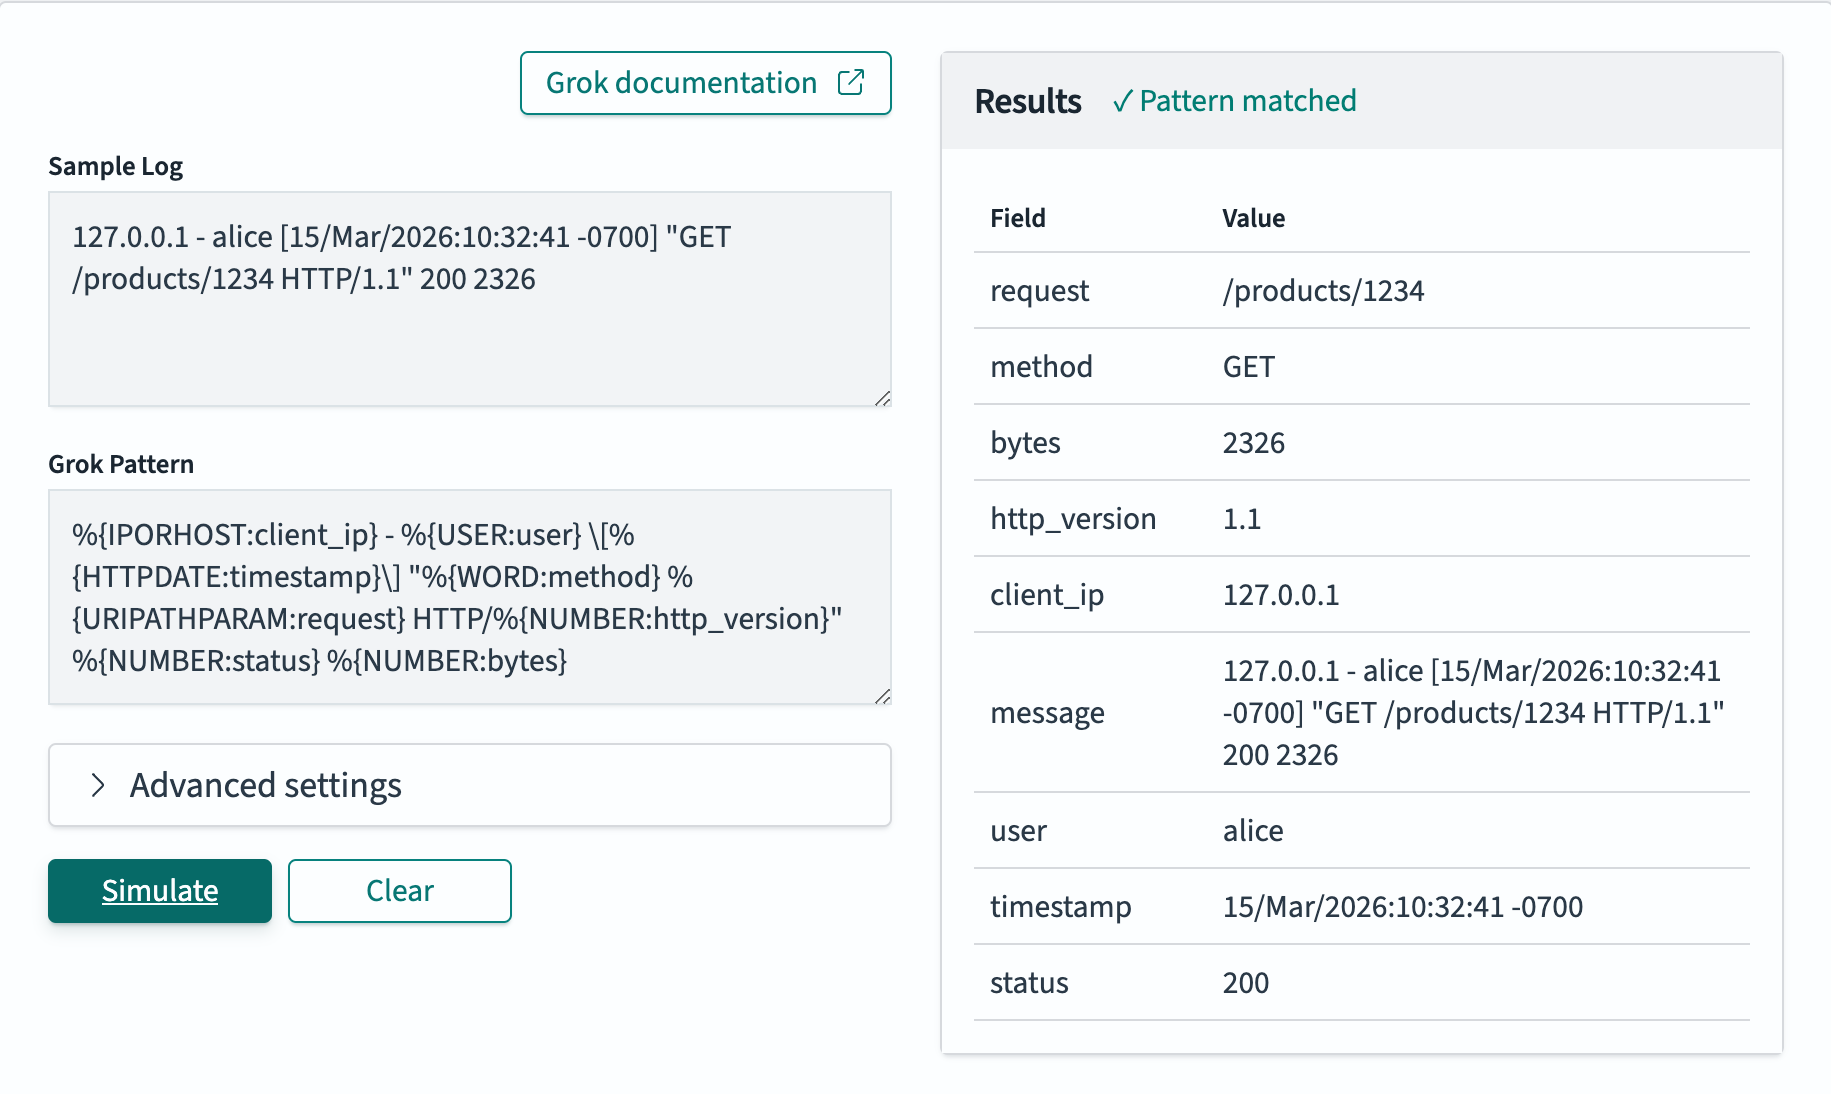
To clear both fields and the results, select Clear.
To open the Grok processor documentation, select Grok documentation.
Configuring advanced settings
To define your own patterns or return every match, select Advanced settings. You can configure the following settings:
- Custom pattern definitions: Defines patterns that aren’t included in the built-in pattern set. Enter one pattern per line in the format
PATTERN_NAME pattern_regex. After you define a custom pattern, you can reference it in the Grok Pattern field using the%{PATTERN_NAME:field_name}syntax. - Capture all matches: Returns all matches for a pattern instead of only the first match.
Next steps
- For information about the Grok processor and the available built-in patterns, see Grok processor.
- For information about creating ingest pipelines, see Ingest pipelines.