Query Profiler
Use the Query Profiler tab in Dev Tools to measure how long each component of a search query takes to run. The Query Profiler runs your query with the Profile API and presents the results as a visualization, so you can identify the queries and aggregations that consume the most time.
When you open the Query Profiler, the editor contains the following default query, which includes the profile parameter, as shown in the following image.
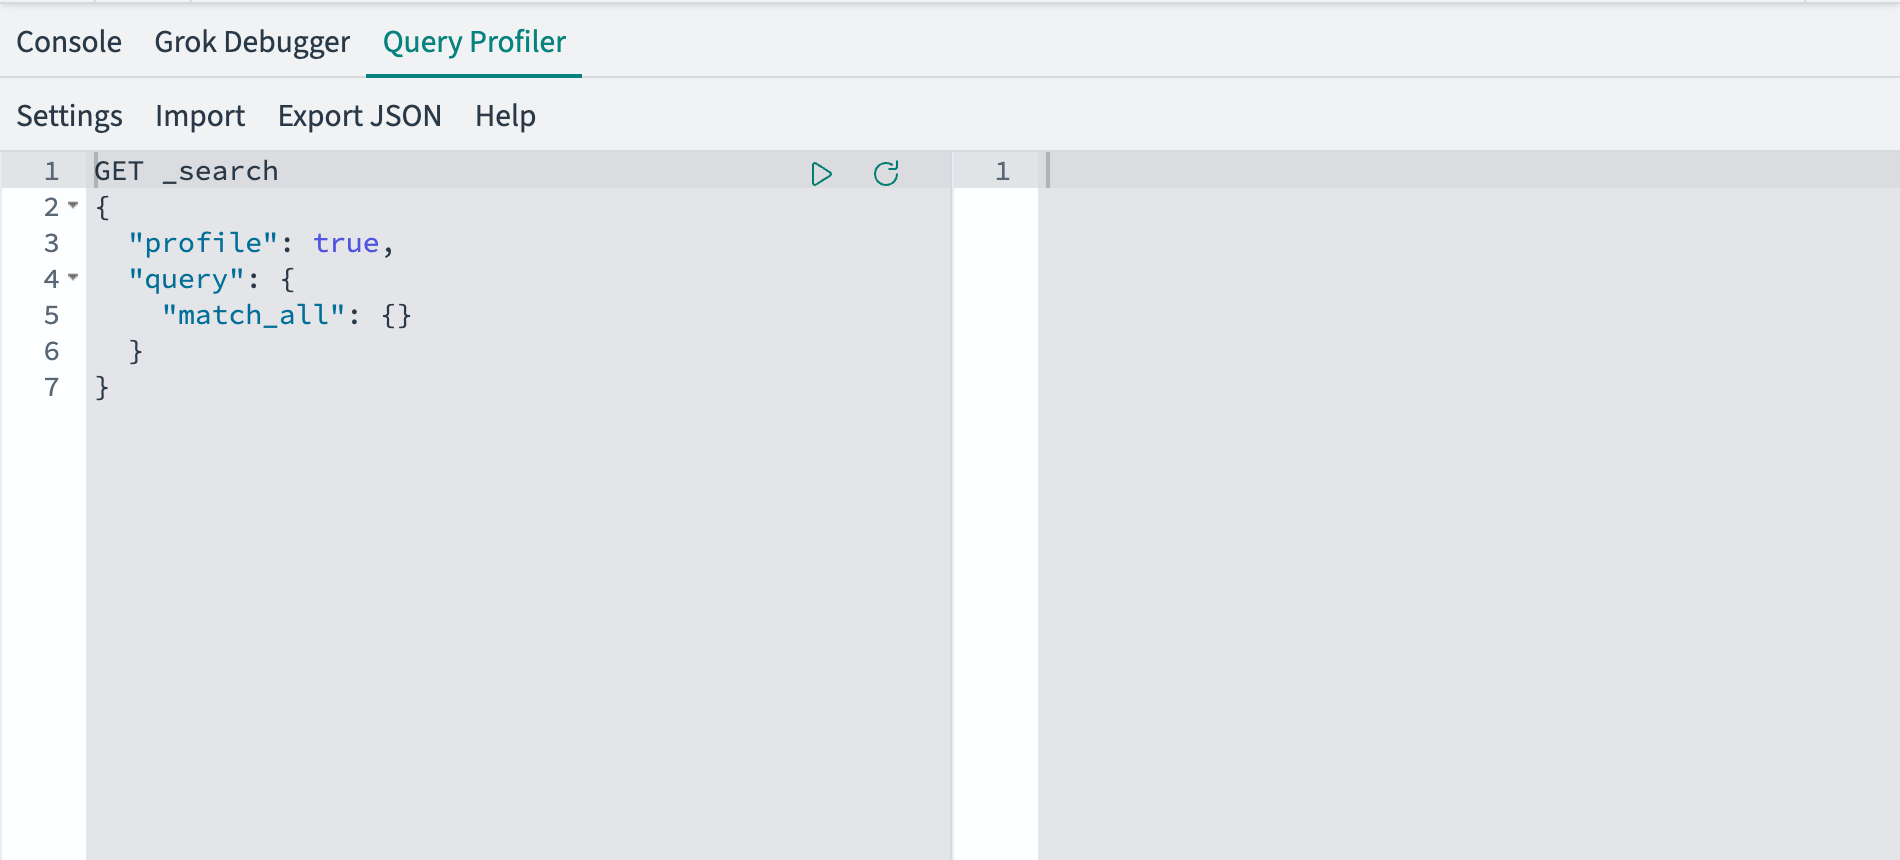
When you select Visualize profile, the Query Profiler collects profiling data even if your query doesn’t contain the profile parameter. To include the profiling data in the response pane, keep "profile": true in the query.
Prerequisites
The examples on this page use the Sample eCommerce orders dataset. If you’re using a local installation of OpenSearch Dashboards and haven’t added sample data yet, see Add sample data.
Profiling a query
To profile a query, follow these steps:
- Navigate to Dev Tools and select Query Profiler at the top of the page.
-
Replace the default query in the editor pane with the query you want to profile. For example, enter the following query, which searches the sample e-commerce data and computes an average order total and a breakdown by customer gender:
GET opensearch_dashboards_sample_data_ecommerce/_search { "profile": true, "query": { "bool": { "must": [ { "match": { "category": "Clothing" } }, { "match": { "manufacturer": "Elitelligence" } } ], "filter": [ { "range": { "taxful_total_price": { "gte": 50 } } } ] } }, "aggs": { "avg_price": { "avg": { "field": "taxful_total_price" } }, "by_gender": { "terms": { "field": "customer_gender" } } } } - Select the play icon (
 ) or press
 Ctrl/Cmd+Enterto run the query. OpenSearch displays the response in the right pane. - Select Visualize profile.
To restore the default query and clear the results, select the reset icon next to the play icon.
Reviewing shard timings
The Profile Results section lists the shards that processed the query, with the Search time and Aggregation time for each shard, as shown in the following image.
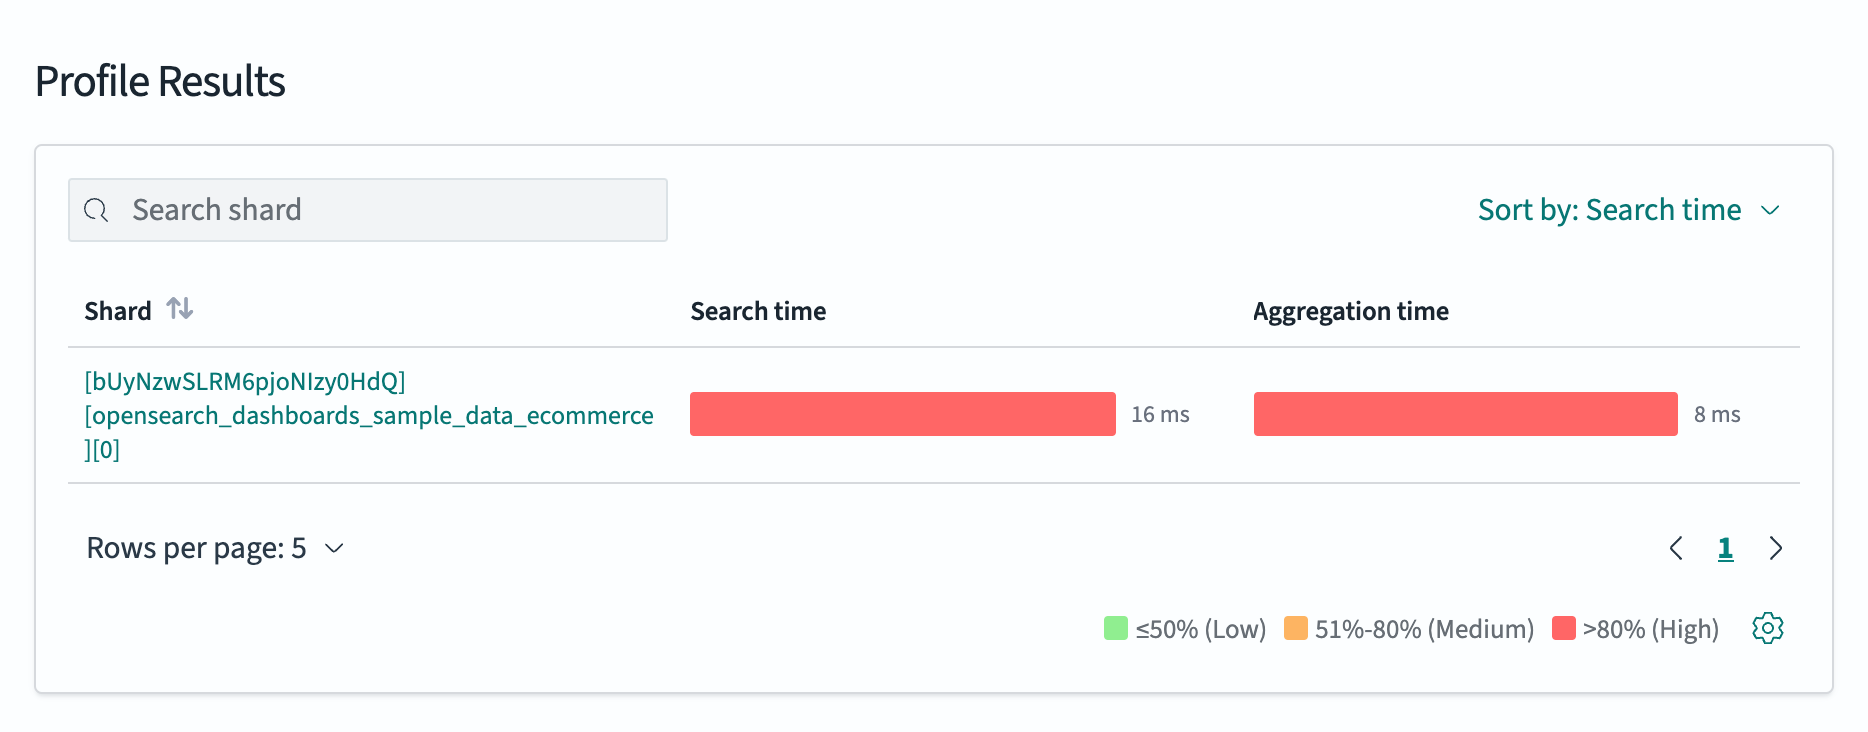
The bar colors indicate how much of the maximum time each shard consumed:
- Green: 50% or less (low)
- Orange: 51–80% (medium)
- Red: More than 80% (high)
To change these percentages, select the gear icon next to the legend and update the Red (>80%) and Orange (>50%) thresholds. To restore the default values, select Reset to defaults.
You can also perform the following actions in this section:
- To find a specific shard, enter its name in the Search shard field.
- To order the list by aggregation time instead of search time, select Sort by: Search time and then choose Sort by: Aggregation time.
- To change the number of shards displayed, select Rows per page.
Reviewing query timings
Select a shard to display its query breakdown. The left pane contains a Search tab and an Aggregation tab, each listing the components that ran on that shard and the time each one took. Select the arrow next to a component to expand its subqueries.
Select a component to display its details, as shown in the following image.
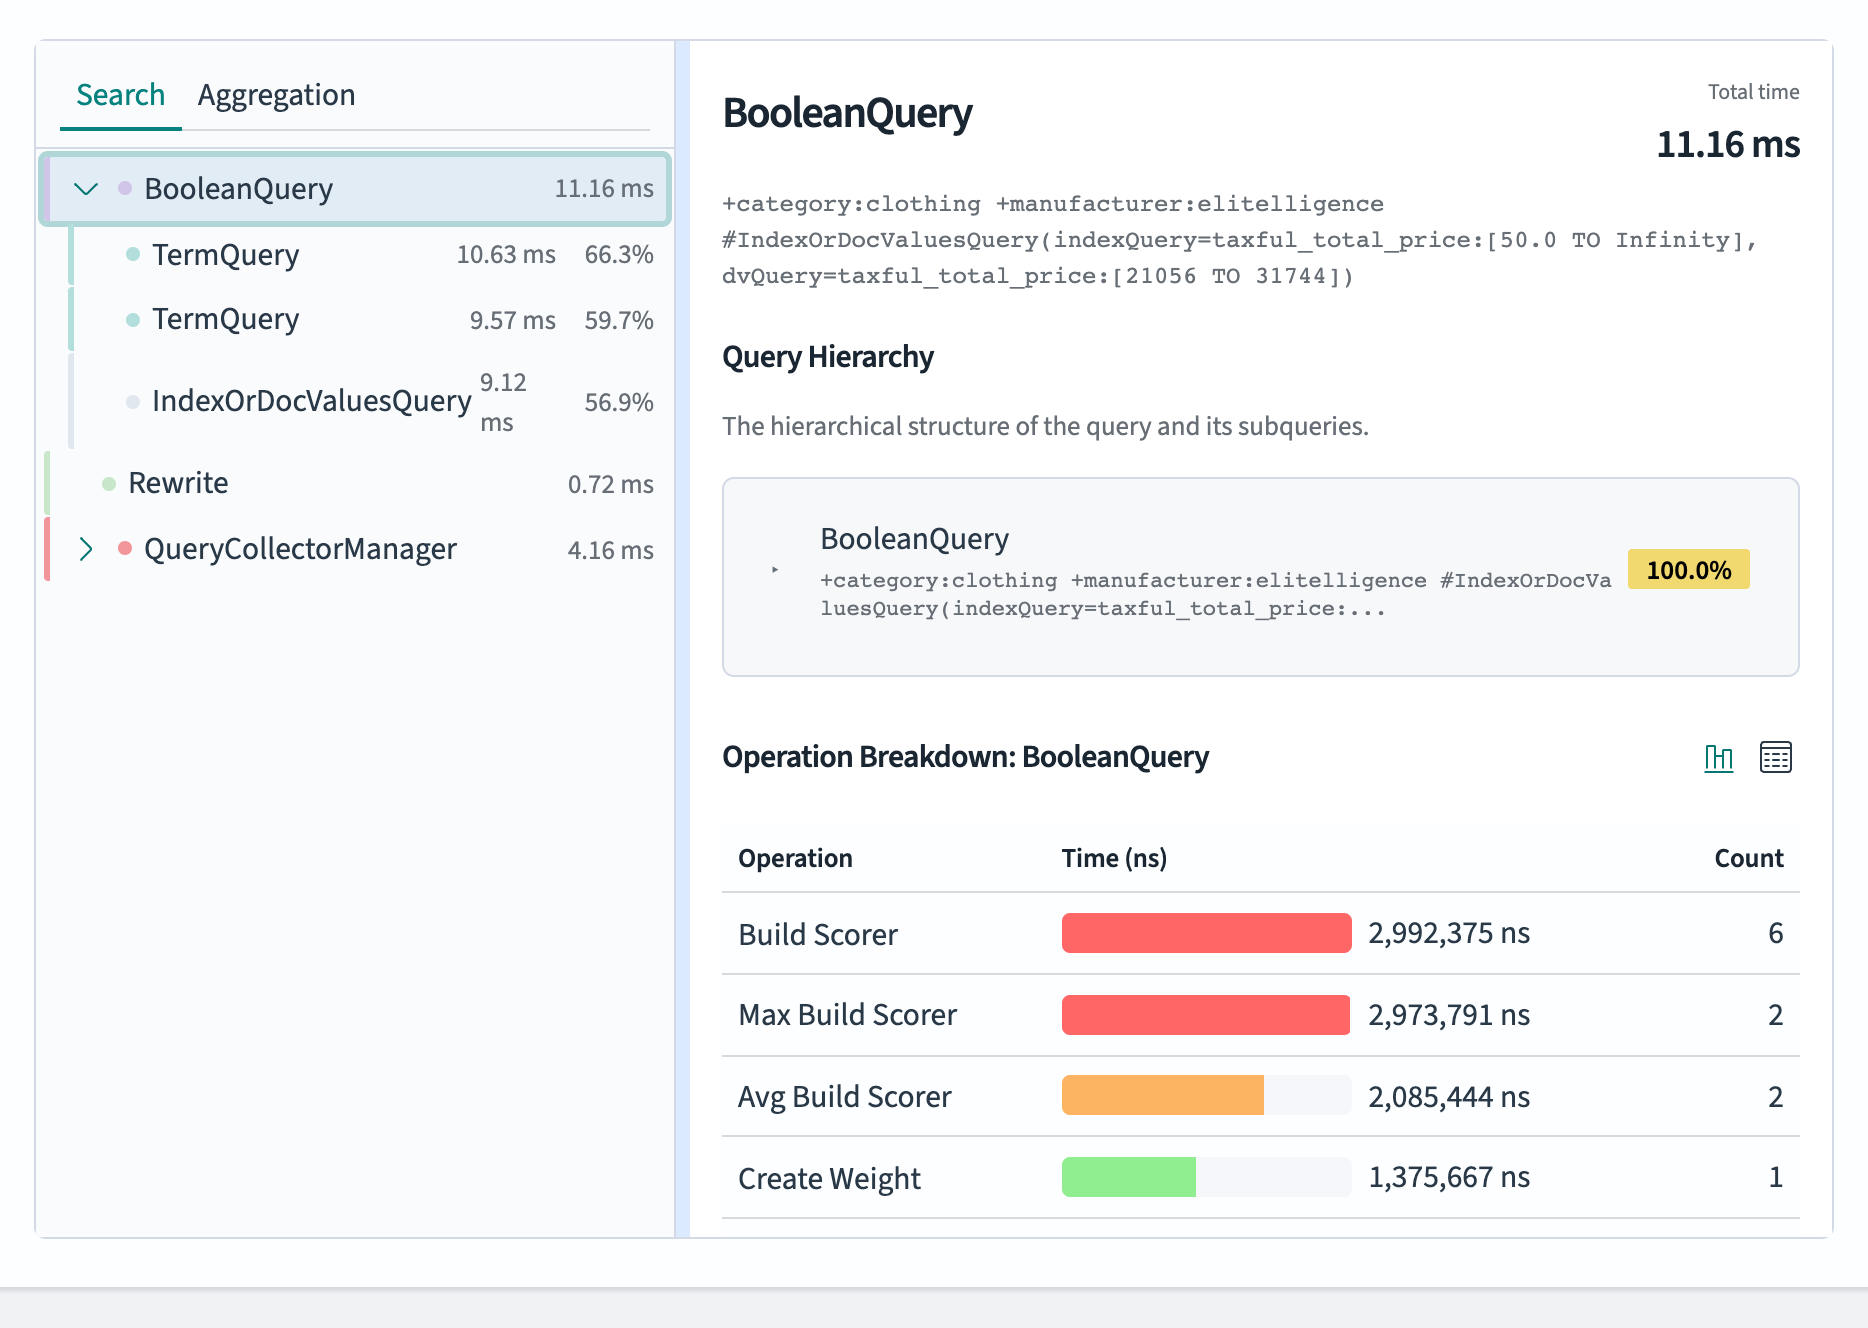
The details pane contains the following information:
- The component name, the Lucene query it rewrote to, and the Total time.
- Query Hierarchy: The hierarchical structure of the query and its subqueries, with the percentage of total time for each.
- Operation Breakdown: The low-level Lucene operations that the component performed, such as
Create Weight,Build Scorer, andNext Doc, with the time in nanoseconds and the number of times each operation ran.
To switch between the chart and table views of the operation breakdown, select the Visual breakdown or Raw data icon on the right side of the Operation Breakdown heading.
Importing and exporting profile results
To save the profile results, select Export JSON from the top menu. The Query Profiler downloads the results as a profile.json file.
To load a query or a previously saved profile, select Import from the top menu, choose one of the following options in Import to, select the file, and then select Import:
- Search query: Loads a search query into the editor pane.
- Profile JSON: Loads profile results and displays the visualization without running a query.
Updating the Query Profiler settings
To update your preferences, select Settings from the top menu. You can configure the following settings:
- Font Size: Sets the editor font size.
- Wrap long lines: Wraps lines that exceed the editor width.
To view help for the Query Profiler, select Help from the top menu.
Next steps
- For information about the API that the Query Profiler uses, see Profile API.
- For information about writing queries, see Query DSL.