Query panel
Use the query panel to choose a query language and dataset, write or build a query, and run it to generate data for a visualization.
The query panel supports Piped Processing Language (PPL), Prometheus Query Language (PromQL), and, when enabled, SQL. To enable SQL, add the following setting to your opensearch_dashboards.yml file:
explore.sqlSupport.enabled: true
AI query generation is available when prompt mode is enabled for the selected dataset.
Query panel controls
The query panel includes the following controls.
| Control | Description |
|---|---|
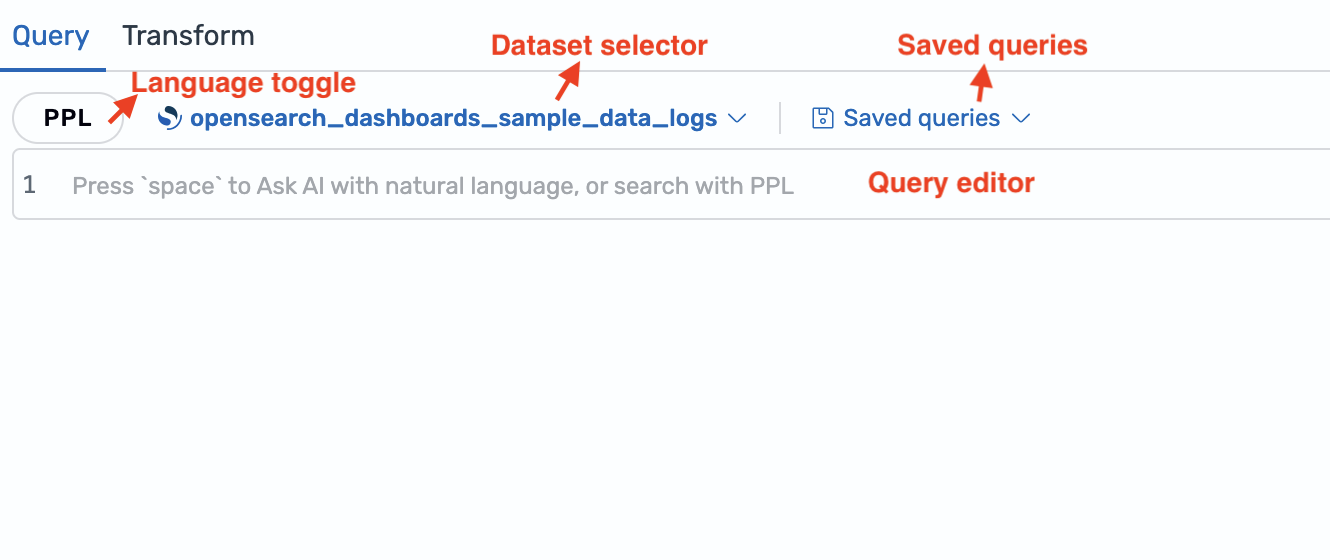
| Language toggle | Switches the editor between PPL, PromQL, SQL, and AI when those options are available. |
| Dataset selector | Selects the dataset or data source queried by the editor. Available datasets depend on the selected language. |
| Saved queries | Saves the current query or loads a previously saved query. |
| Query editor | Provides the text editor, or the PromQL editor or builder when PromQL is selected. |
The following image shows the query panel with the language toggle, dataset selector, saved queries menu, and query editor.
Selecting a query language
Use the language toggle to select the query language. The selected language determines which datasets are available and which editor features are shown.
| Language | Description |
|---|---|
| PPL | Queries OpenSearch datasets using Piped Processing Language. |
| PromQL | Queries Prometheus data sources and displays the PromQL multi-query editor. |
| SQL | Queries OpenSearch datasets using SQL. This option appears only when explore.sqlSupport.enabled is set to true. |
| AI | Generates a query from a natural language prompt. This option appears only when prompt mode is available. |
Selecting a dataset
Use the dataset selector to choose the data queried by the visualization editor. Dataset availability depends on the selected query language:
- PPL and SQL use OpenSearch datasets, such as indexes and index patterns.
- PromQL uses Prometheus datasets.
Writing PPL queries
After you select a dataset, you can write a PPL query. The visualization editor uses the selected dataset as the query source.
For example, if opensearch_dashboards_sample_data_logs is selected, you can enter the following query:
| stats count() by response
You can also include the source explicitly:
source = opensearch_dashboards_sample_data_logs | stats count() by response
Writing PromQL queries
When PromQL is selected, the editor displays a multi-query editor. Each query row can be written in Builder mode or Code mode.
The following image shows the PromQL multi-query editor.
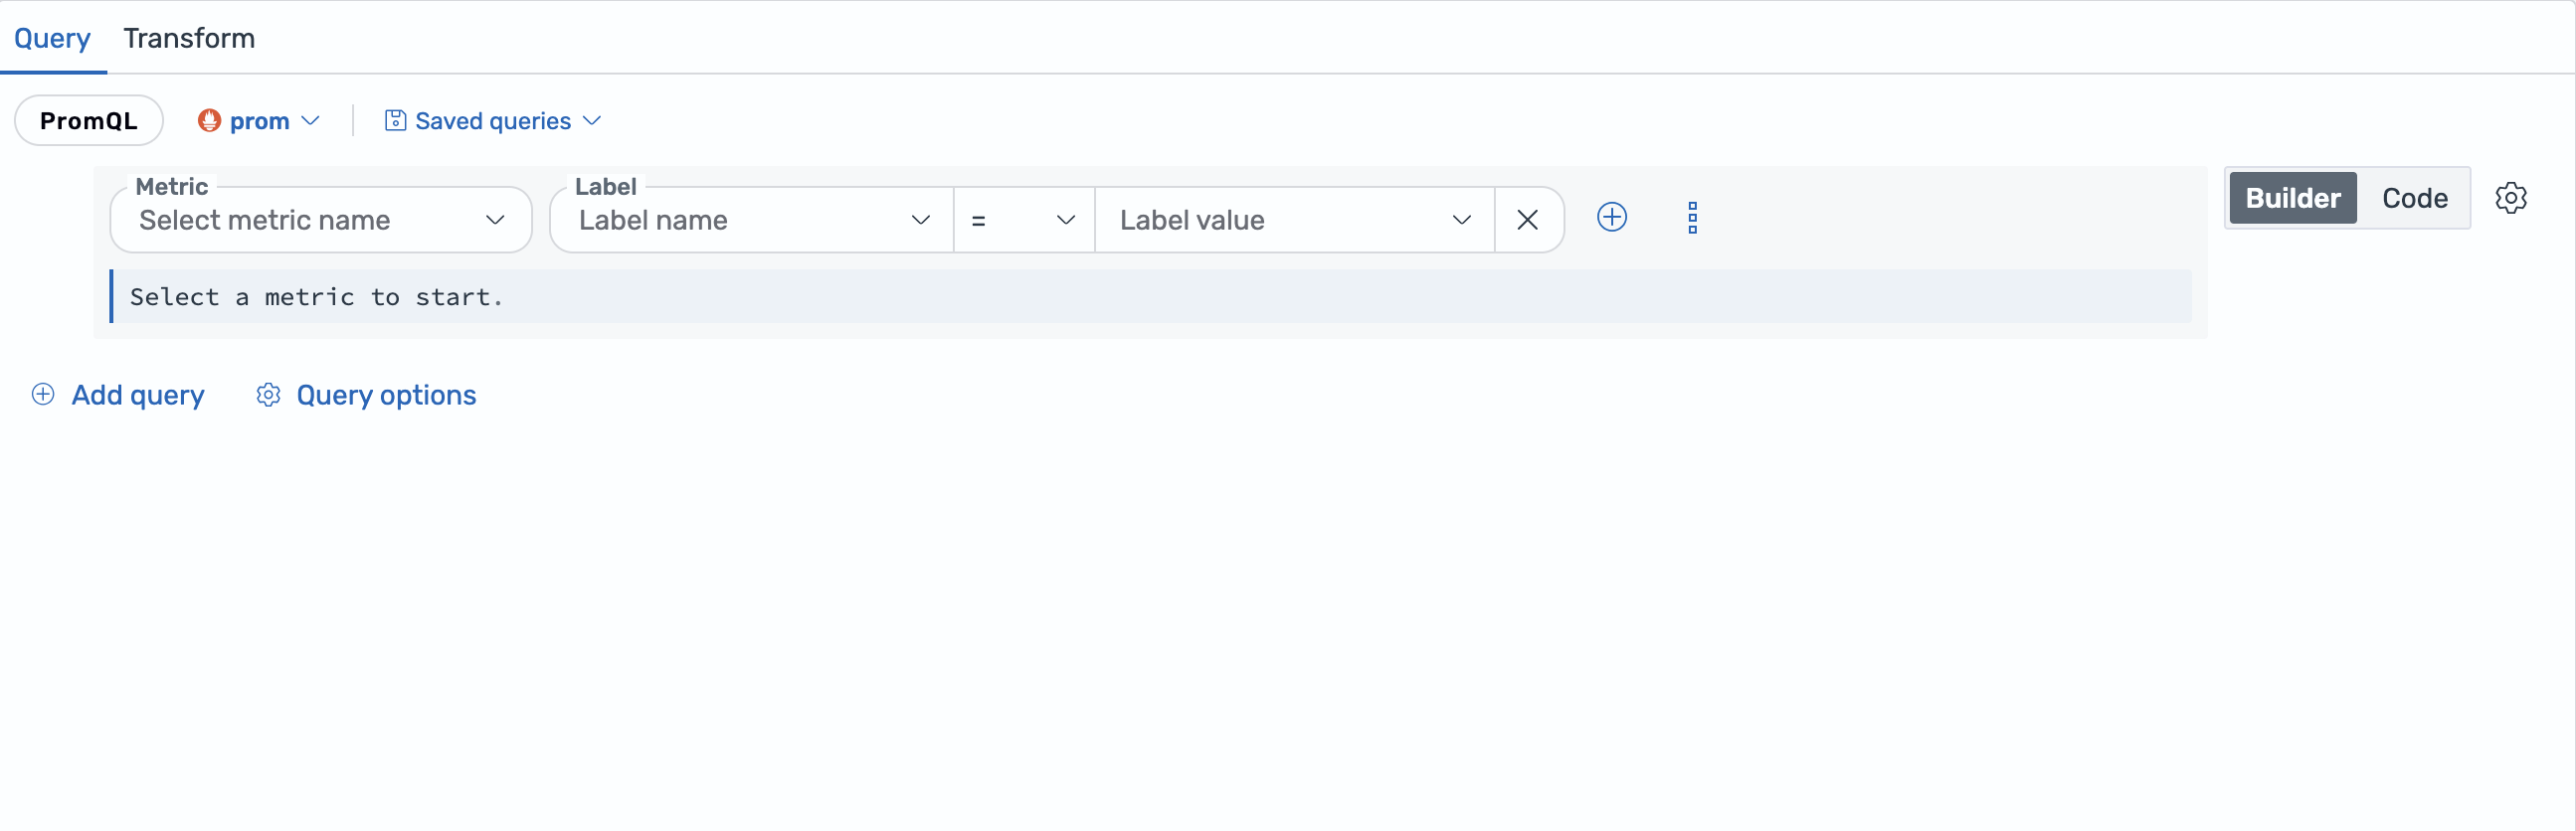
Use Builder mode to build a PromQL query from metric names, label filters, and operations. Use Code mode to write PromQL directly. Some code queries cannot be represented in Builder mode, so switching back to Builder mode may not be available for complex queries.
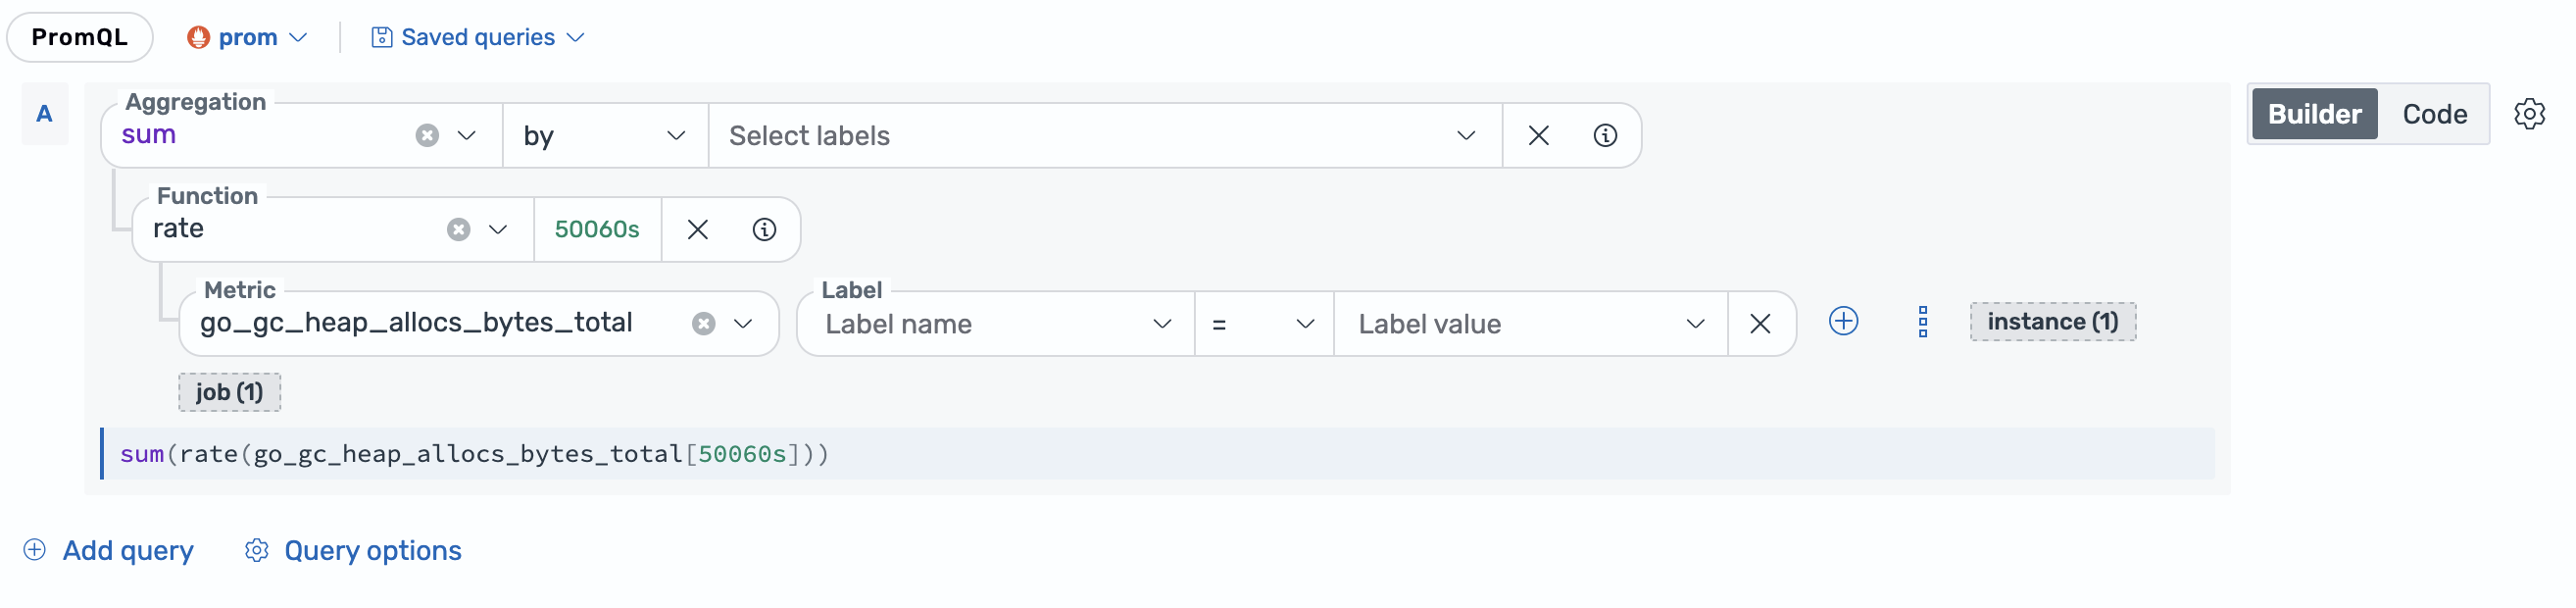
The following example uses Builder mode to write a PromQL query:
sum(rate(go_gc_heap_allocs_bytes_total[50060s]))
The following image shows the same query built in Builder mode from a sum aggregation, a rate function with a 50060s window, and the go_gc_heap_allocs_bytes_total metric.
You can manage PromQL query rows as follows:
- Select Add query to add another PromQL query row.
- Select the remove icon to delete a query row.
- Drag query rows to reorder them.
- Select Update to run the query. In Code mode, you can also press Command+Enter (macOS) or Ctrl+Enter (Windows and Linux).
PromQL query options
PromQL provides per-query options for each query row and shared options for all rows. To configure the options for a single query row, select the gear icon at the end of the row. To configure the options shared by all rows, select Query options.
The following image shows the per-query options for a PromQL query row.
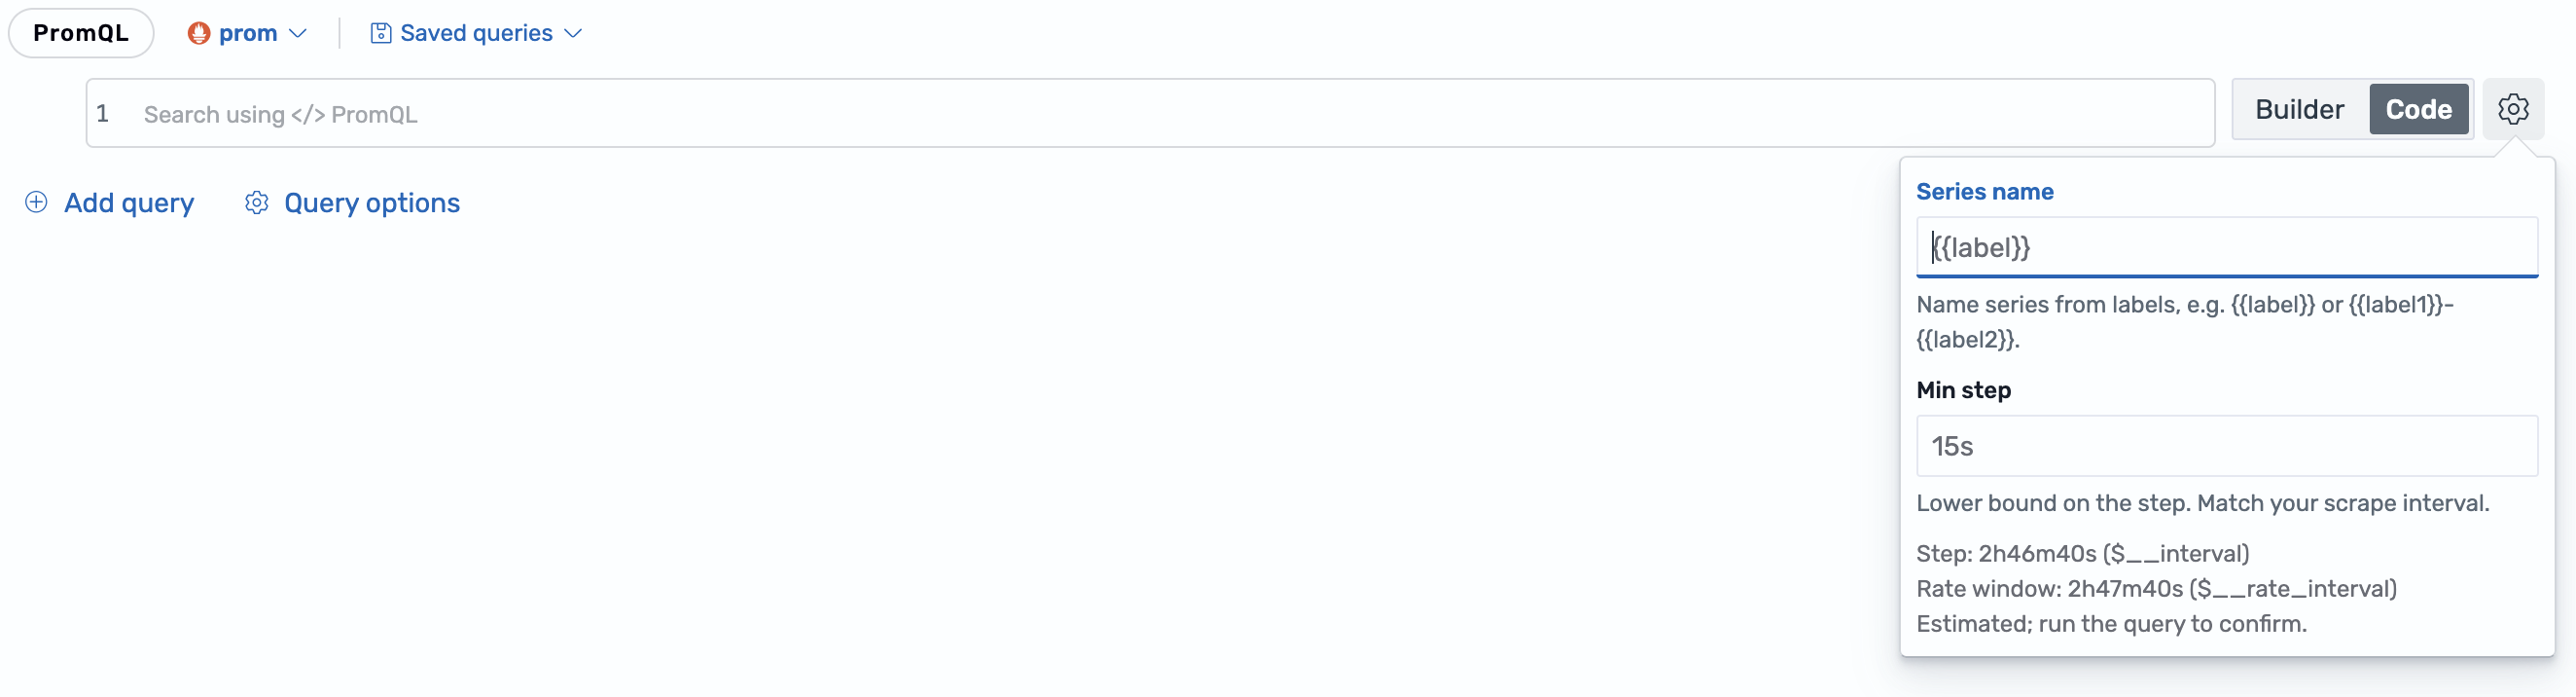
Series name
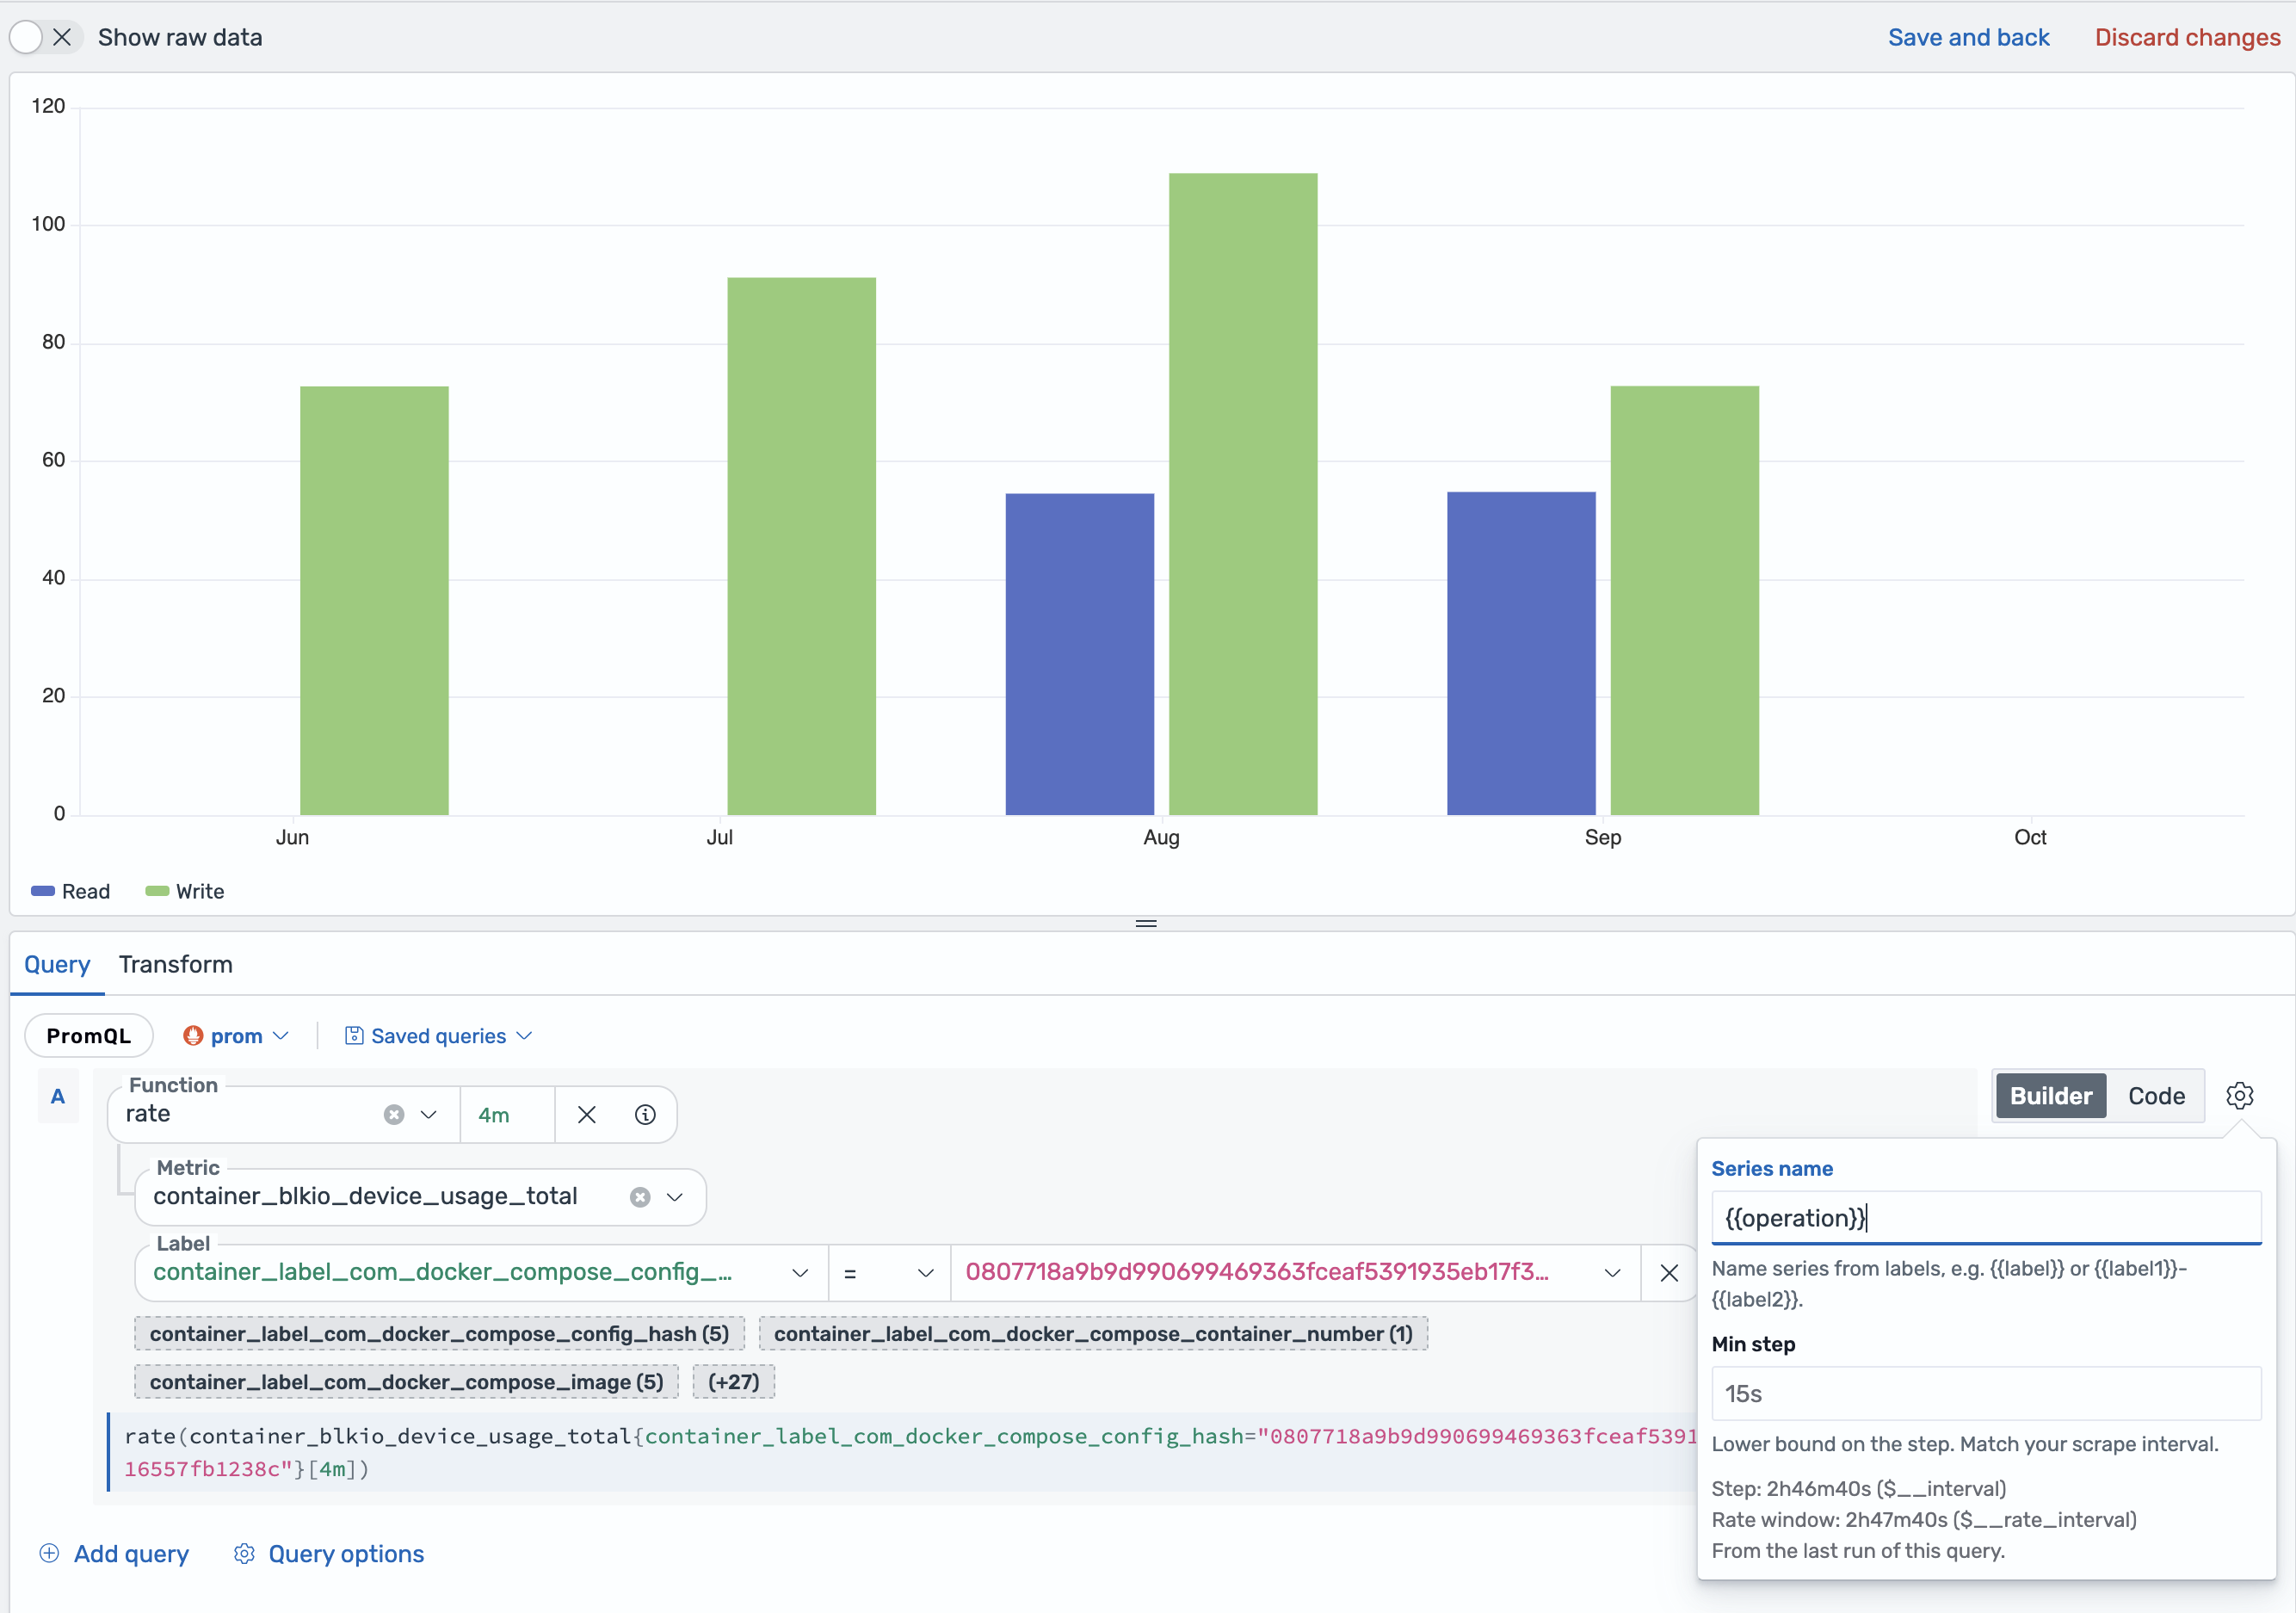
Use Series name to customize the displayed series name. You can reference metric labels using double curly braces.
For example, enter {{job}} to name each series by its job label, or enter {{job}}-{{instance}} to combine multiple labels.
The following bar chart sets Series name to {{operation}}, so the legend names each series by its operation label, Read and Write.
Minimum step
Use Min step to set the lower bound for the PromQL query step. Enter a duration with a unit, such as 15s, 1m, or 2h. Match this value to your Prometheus scrape interval. The options panel shows the resulting step ($__interval) and rate window ($__rate_interval) as estimates; run the query to confirm the values.
Maximum number of data points
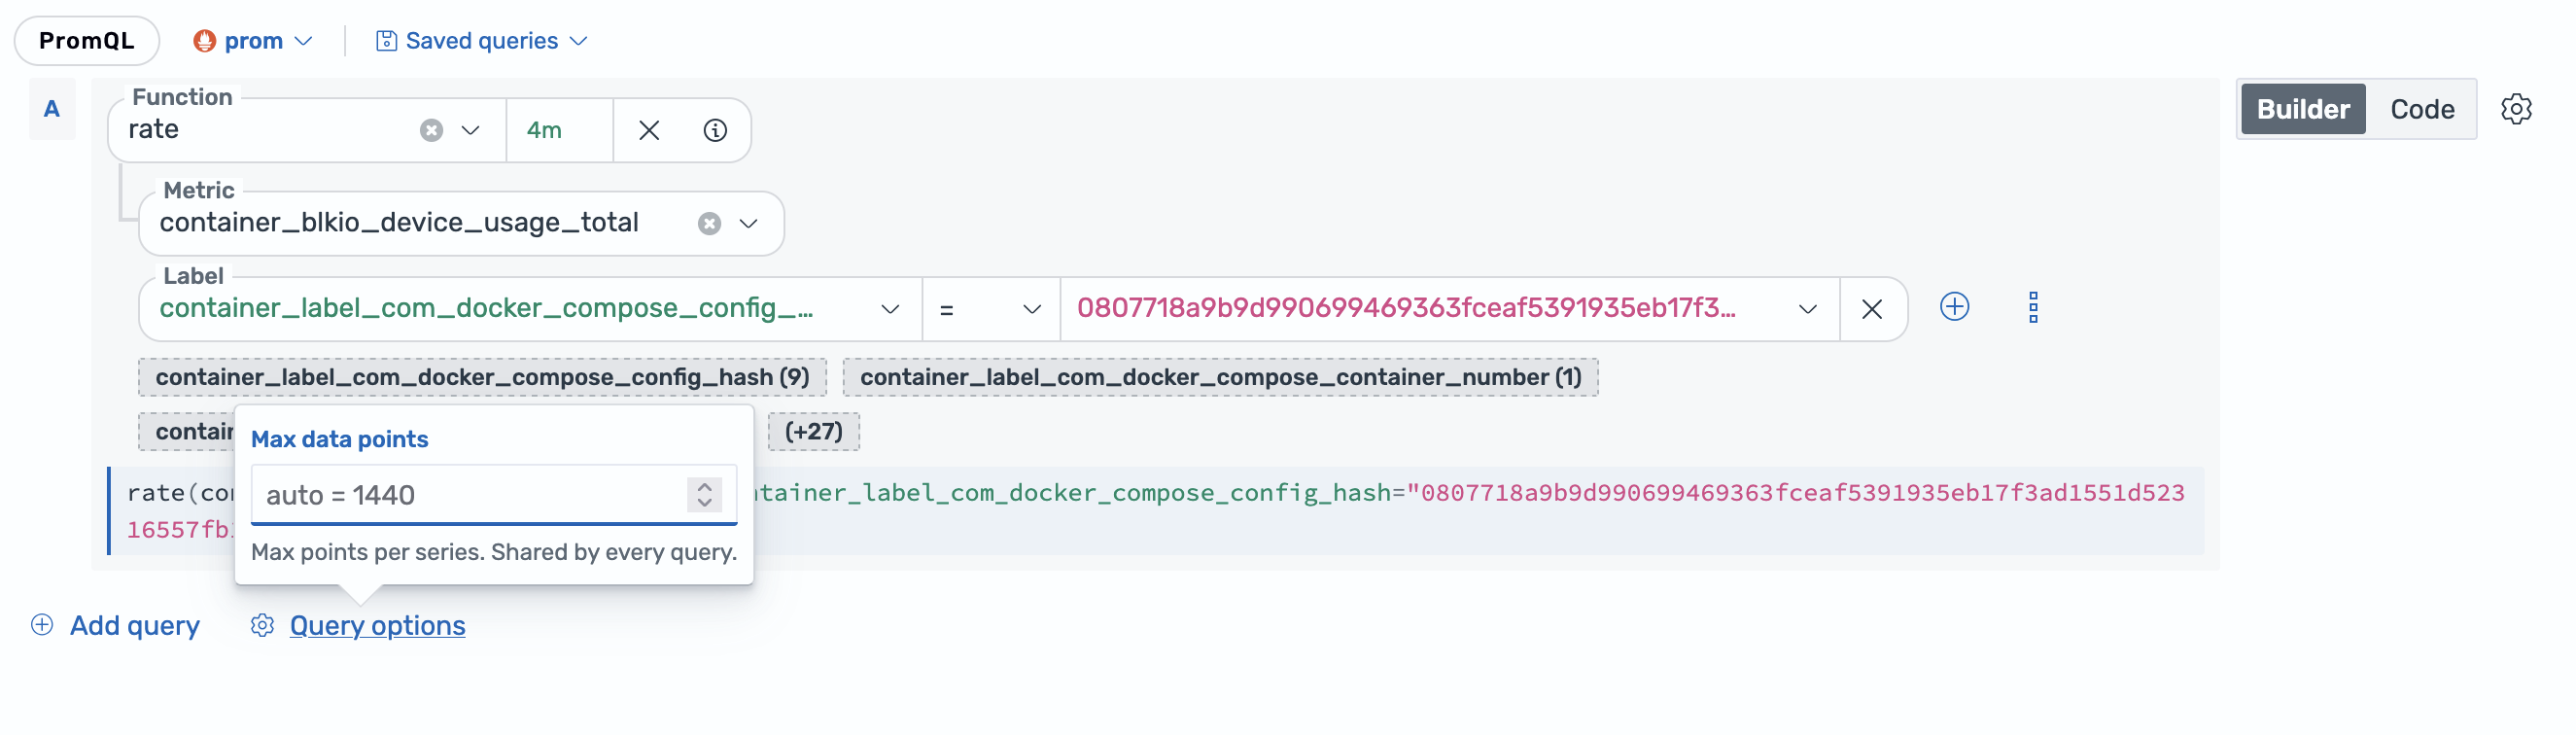
Use Max data points to set the maximum number of points returned per series. This option is shared by all PromQL query rows. Leave this setting empty to use the automatic value.
The following image shows Max data points in the shared Query options panel, with the automatic value of 1440.
Saving and reusing queries
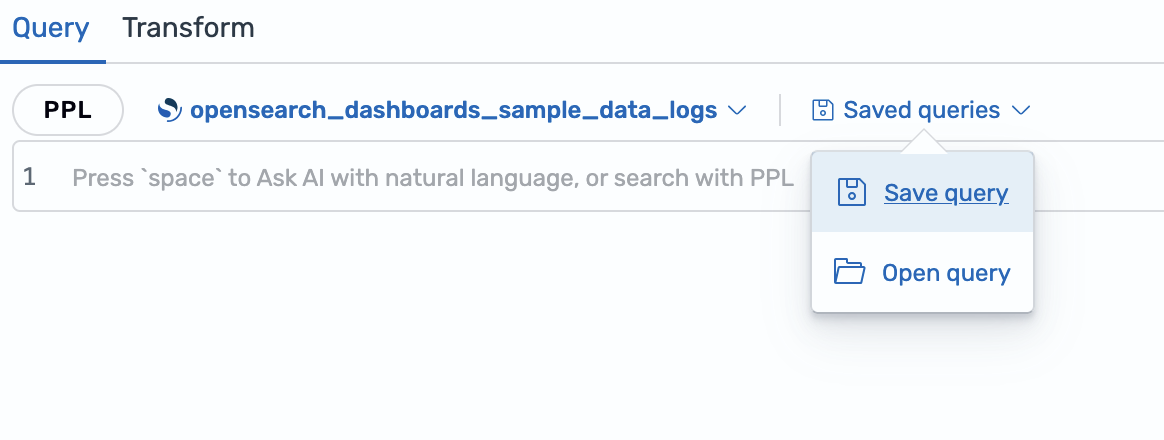
To save a query for reuse, select Saved queries > Save query. To load a saved query, select Saved queries > Open query, and then choose the query to load.
The following image shows the Saved queries menu with the Save query and Open query options.