Data transformations
Data transformations modify query results before a visualization is rendered. Use transformations to reshape, filter, sort, calculate, or summarize data without changing the original query.
Transformations are applied as a pipeline. Each transformation receives the output of the previous transformation as its input, so the order of transformations can change the final result.
Use transformations when you need to:
- Filter rows after a query returns results.
- Keep or remove specific fields from the result table.
- Sort rows before visualizing them.
- Limit the number of rows shown in a visualization.
- Convert field values to another type, such as number, string, Boolean, or date.
- Extract fields from an object or JSON string into top-level columns.
- Add a calculated field from existing numeric fields.
- Group rows by a field and aggregate the remaining fields.
Transformations are useful when the query returns the right data but not in the exact shape required by the visualization. If the data can be filtered or aggregated more efficiently in the query, update the query first.
Supported transformations
The following table lists the available transformations.
| Transformation | Description |
|---|---|
| Limit | Keeps only the specified number of rows. |
| Sort by | Sorts rows by one field in ascending or descending order. |
| Filter | Keeps rows that match a field, operator, and value condition. |
| Filter fields | Includes or excludes selected fields. |
| Convert field type | Converts field values to string, number, Boolean, or date. |
| Group by | Groups rows by one field and aggregates the remaining fields. |
| Extract fields | Extracts nested object or JSON string fields into top-level fields. |
| Add field | Creates a calculated numeric field from existing numeric fields or constants. |
Adding and managing transformations
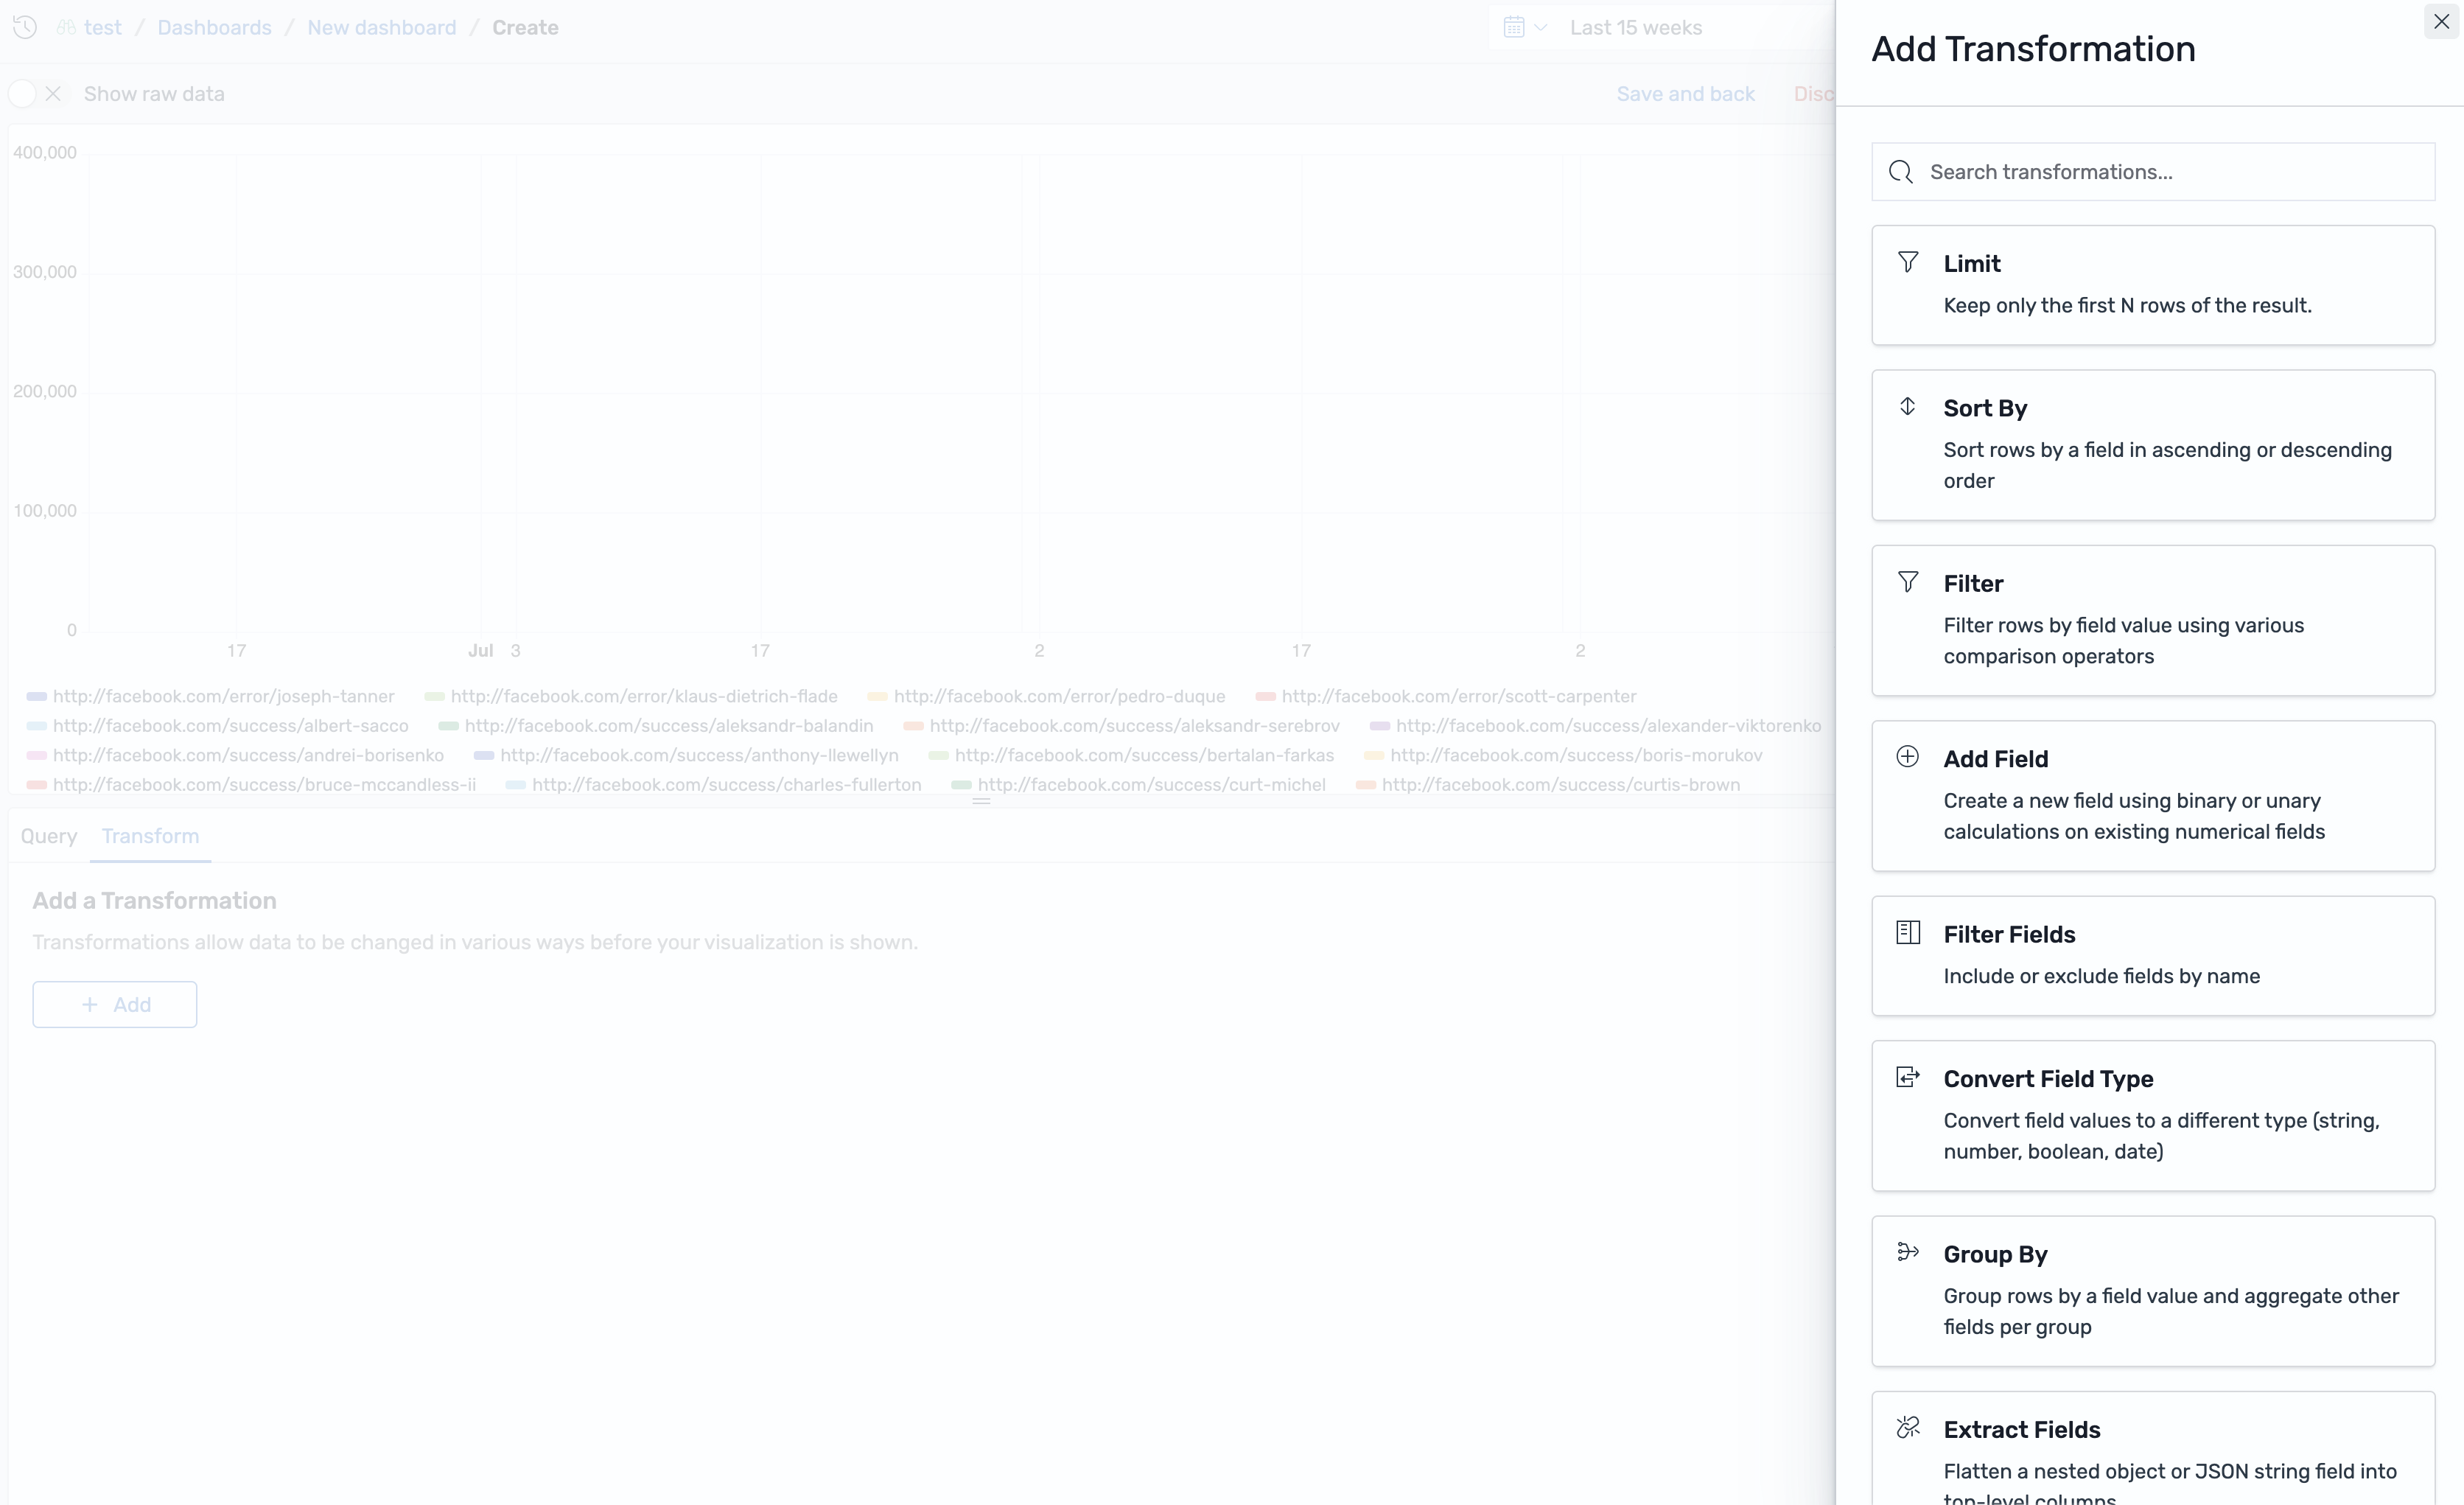
To add a transformation, go to the Transform tab, select Add, and then choose a transformation in the Add transformation flyout. A transformation card is added to the pipeline.
The following image shows the Add transformation flyout listing the available transformations.
You can manage transformations in the pipeline as follows:
- Update the controls in a transformation card to edit it.
- Select the eye icon to hide or show a transformation. Hidden transformations remain in the pipeline but are skipped.
- Select the delete icon to remove a transformation.
- Drag transformation cards to change the pipeline order.
Transformation order
Transformation order matters. The pipeline runs from top to bottom, and each step uses the result produced by the previous step. Fields created or removed by one transformation affect the fields available to later transformations.
For example, the following pipeline filters successful requests, sorts them by byte count, and keeps only the largest result:
- Filter:
responseequals200. - Sort by:
bytes, descending. - Limit:
1.
The following table shows the input data.
extension | response | bytes |
|---|---|---|
css | 200 | 14074 |
png | 404 | 7911 |
js | 200 | 1024 |
css | 503 | 2048 |
The following table shows the result.
extension | response | bytes |
|---|---|---|
css | 200 | 14074 |
Example data
The following examples use a small result table based on the opensearch_dashboards_sample_data_logs sample index.
@timestamp | extension | response | bytes | machine.os | geo |
|---|---|---|---|---|---|
2026-09-20T10:00:00Z | css | 200 | 14074 | win 8 | {"src":"US","dest":"CN"} |
2026-09-20T10:01:00Z | png | 404 | 7911 | osx | {"src":"IN","dest":"US"} |
2026-09-20T10:02:00Z | js | 200 | 1024 | win xp | {"src":"US","dest":"GB"} |
2026-09-20T10:03:00Z | css | 503 | 2048 | ios | {"src":"CN","dest":"US"} |
Transformation types
The following sections describe each transformation and show the result of applying it to the example data.
Limit
Use Limit to keep only the specified number of rows from the beginning of the result.
The transformation uses the following configuration:
- Number of rows:
2
The following table shows the input data.
extension | response | bytes |
|---|---|---|
css | 200 | 14074 |
png | 404 | 7911 |
js | 200 | 1024 |
css | 503 | 2048 |
The following table shows the result.
extension | response | bytes |
|---|---|---|
css | 200 | 14074 |
png | 404 | 7911 |
Sort by
Use Sort by to sort rows by a selected field.
The transformation uses the following configuration:
- Field:
bytes - Order: Descending
The following table shows the input data.
extension | response | bytes |
|---|---|---|
css | 200 | 14074 |
png | 404 | 7911 |
js | 200 | 1024 |
css | 503 | 2048 |
The following table shows the result.
extension | response | bytes |
|---|---|---|
css | 200 | 14074 |
png | 404 | 7911 |
css | 503 | 2048 |
js | 200 | 1024 |
Filter
Use Filter to keep rows that match a condition. Available operators depend on the selected field type.
The transformation uses the following configuration:
- Field:
response - Operator: Equals
- Value:
200
The following table shows the input data.
extension | response | bytes |
|---|---|---|
css | 200 | 14074 |
png | 404 | 7911 |
js | 200 | 1024 |
css | 503 | 2048 |
The following table shows the result.
extension | response | bytes |
|---|---|---|
css | 200 | 14074 |
js | 200 | 1024 |
Filter fields
Use Filter fields to include or exclude selected fields.
The transformation uses the following configuration:
- Mode: Include
- Fields:
extension,response,bytes
The following table shows the input data.
@timestamp | extension | response | bytes | machine.os |
|---|---|---|---|---|
2026-09-20T10:00:00Z | css | 200 | 14074 | win 8 |
2026-09-20T10:01:00Z | png | 404 | 7911 | osx |
The following table shows the result.
extension | response | bytes |
|---|---|---|
css | 200 | 14074 |
png | 404 | 7911 |
Convert field type
Use Convert field type to cast selected field values to another type. Supported target types are string, number, Boolean, and date.
The transformation uses the following configuration:
- Field:
response - Target type: Number
The following table shows the input data.
extension | response | bytes |
|---|---|---|
css | "200" | 14074 |
png | "404" | 7911 |
The following table shows the result.
extension | response | bytes |
|---|---|---|
css | 200 | 14074 |
png | 404 | 7911 |
Group by
Use Group by to group rows by a field value and aggregate other fields for each group.
The transformation uses the following configuration:
- Field:
extension - Aggregations:
bytesas Total andresponseas Count
The following table shows the input data.
extension | response | bytes |
|---|---|---|
css | 200 | 14074 |
png | 404 | 7911 |
js | 200 | 1024 |
css | 503 | 2048 |
The following table shows the result.
extension | total_bytes | count_response |
|---|---|---|
css | 16122 | 2 |
png | 7911 | 1 |
js | 1024 | 1 |
Extract fields
Use Extract fields to flatten a nested object or JSON string field into top-level fields.
The transformation uses the following configuration:
- Field:
geo - Format: Object
- Column prefix:
geo_
The following table shows the input data.
extension | geo |
|---|---|
css | {"src":"US","dest":"CN"} |
png | {"src":"IN","dest":"US"} |
The following table shows the result.
extension | geo | geo_src | geo_dest |
|---|---|---|---|
css | {"src":"US","dest":"CN"} | US | CN |
png | {"src":"IN","dest":"US"} | IN | US |
Add field
Use Add field to create a calculated numeric field. Add field supports binary calculations, unary calculations, and cross-field calculations.
The transformation uses the following configuration:
- Mode: Binary
- Field 1:
bytes - Operator:
+ - Field 2: custom value
100 - Alias:
bytes_with_overhead
The following table shows the input data.
extension | bytes |
|---|---|
css | 14074 |
png | 7911 |
js | 1024 |
The following table shows the result.
extension | bytes | bytes_with_overhead |
|---|---|---|
css | 14074 | 14174 |
png | 7911 | 8011 |
js | 1024 | 1124 |