Analyzing Jaeger trace data
Introduced 2.5
If you use OpenSearch as the storage backend for Jaeger, you can analyze Jaeger trace data using trace analytics in OpenSearch Dashboards. Trace analytics shows the error rates and latency of your services and operations. You can filter traces and examine the spans of an individual trace to locate service issues.
Trace analytics supports two data sources. Select Data Prepper to analyze trace data that OpenSearch Data Prepper ingested into OpenSearch. Select Jaeger to analyze trace data that Jaeger stored in OpenSearch.
Jaeger indexes
Jaeger and Data Prepper store trace data in different indexes. Data Prepper writes to indexes named otel-v1-apm-span-* and otel-v1-apm-service-map*. Jaeger writes to indexes named jaeger-span-* and jaeger-service-*. By default, Jaeger creates a new span index and a new service index each day.
Error data requirements
Trace analytics identifies spans that contain errors using the tag.error field. Jaeger v2 always stores the error tag as a field in the span document, so error data is available without additional configuration.
Earlier Jaeger collectors store tags in a nested array by default. If you use one of these collectors, set the ES_TAGS_AS_FIELDS_ALL environment variable to true. Otherwise, error data is not available in trace analytics.
Setting up OpenSearch to use Jaeger data
The following example uses Docker Compose to run a single-node OpenSearch cluster, OpenSearch Dashboards, Jaeger, and the Jaeger HotROD sample application. HotROD sends trace data to Jaeger using the OpenTelemetry Protocol (OTLP), and Jaeger stores the data in OpenSearch.
Step 1: Set the admin password
OpenSearch requires a custom password for the admin user. In an empty directory, create a file named .env containing the following line, replacing <custom-admin-password> with a strong password:
OPENSEARCH_INITIAL_ADMIN_PASSWORD=<custom-admin-password>
Docker Compose reads this file and passes the password to both OpenSearch and Jaeger. For more information, see Admin password requirements.
Step 2: Configure Jaeger
In the same directory, create a file named jaeger-config.yaml containing the following configuration. It configures Jaeger to receive OTLP data and store it in OpenSearch:
service:
  extensions: [jaeger_storage, jaeger_query]
  pipelines:
    traces:
      receivers: [otlp]
      processors: [batch]
      exporters: [jaeger_storage_exporter]

extensions:
  jaeger_query:
    storage:
      traces: opensearch_storage

  jaeger_storage:
    backends:
      opensearch_storage:
        opensearch:
          server_urls:
            - https://opensearch:9200
          tls:
            insecure_skip_verify: true # The demo security configuration uses self-signed certificates
          auth:
            basic:
              username: admin
              password: ${env:OPENSEARCH_PASSWORD}

receivers:
  otlp:
    protocols:
      grpc:
        endpoint: 0.0.0.0:4317
      http:
        endpoint: 0.0.0.0:4318

processors:
  batch:

exporters:
  jaeger_storage_exporter:
    trace_storage: opensearch_storage
Step 3: Create the Docker Compose file
In the same directory, create a file named docker-compose.yml containing the following configuration:
services:
  opensearch:
    image: opensearchproject/opensearch:latest
    environment:
      - discovery.type=single-node
      - bootstrap.memory_lock=true
      - "OPENSEARCH_JAVA_OPTS=-Xms512m -Xmx512m"
      - OPENSEARCH_INITIAL_ADMIN_PASSWORD=${OPENSEARCH_INITIAL_ADMIN_PASSWORD}
    ulimits:
      memlock:
        soft: -1
        hard: -1
      nofile:
        soft: 65536
        hard: 65536
    volumes:
      - opensearch-data:/usr/share/opensearch/data
    ports:
      - "9200:9200"
    healthcheck: # Jaeger starts only after the cluster is available
      test: ["CMD-SHELL", "curl -sk -u admin:$$OPENSEARCH_INITIAL_ADMIN_PASSWORD https://localhost:9200/_cluster/health | grep -qE '\"status\":\"(green|yellow)\"'"]
      interval: 10s
      timeout: 5s
      retries: 30
    networks:
      - opensearch-net

  opensearch-dashboards:
    image: opensearchproject/opensearch-dashboards:latest
    ports:
      - "5601:5601"
    environment:
      OPENSEARCH_HOSTS: '["https://opensearch:9200"]'
    networks:
      - opensearch-net
    depends_on:
      - opensearch

  jaeger:
    image: jaegertracing/jaeger:latest
    command: ["--config", "/etc/jaeger/config.yaml"]
    environment:
      - OPENSEARCH_PASSWORD=${OPENSEARCH_INITIAL_ADMIN_PASSWORD}
    volumes:
      - ./jaeger-config.yaml:/etc/jaeger/config.yaml:ro
    ports:
      - "16686:16686" # Jaeger UI
      - "4317:4317" # OTLP over gRPC
      - "4318:4318" # OTLP over HTTP
    networks:
      - opensearch-net
    depends_on:
      opensearch:
        condition: service_healthy

  hotrod:
    image: jaegertracing/example-hotrod:latest
    command: ["all"]
    environment:
      - OTEL_EXPORTER_OTLP_ENDPOINT=http://jaeger:4318
    ports:
      - "8080:8080"
    networks:
      - opensearch-net
    depends_on:
      - jaeger

volumes:
  opensearch-data:

networks:
  opensearch-net:
Step 4: Start the containers
To start the containers, run the following command:
docker compose up -d
Jaeger and HotROD start after the OpenSearch cluster reports a green or yellow health status, which can take a minute or longer.
To stop the containers and delete their data, run the following command:
docker compose down -v
Step 5: Generate sample data
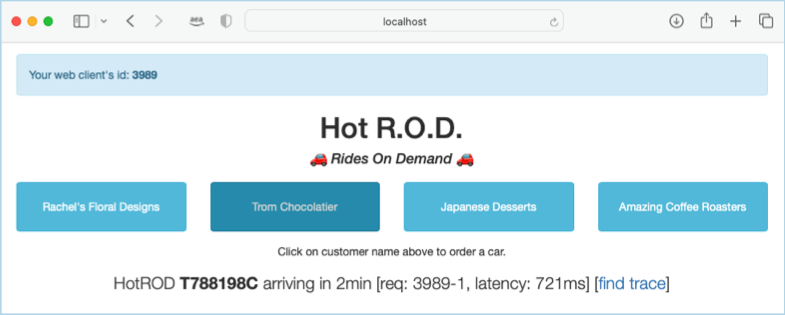
To open the HotROD sample application, go to http://localhost:8080. Each time you select a customer, HotROD generates a trace. Some of the traces contain errors, so the error views in trace analytics display data.
To confirm that Jaeger stored the trace data in OpenSearch, list the Jaeger indexes:
curl -sk -u admin:<custom-admin-password> "https://localhost:9200/_cat/indices/jaeger-*?v"
The response contains a jaeger-span-* index and a jaeger-service-* index for the current day.
Step 6: View trace data in OpenSearch Dashboards
Go to http://localhost:5601 and log in as the admin user with the password you set in Step 1. On the top menu, go to Observability > Traces.
Selecting the data source
To analyze Jaeger data, select Jaeger from the data source selector at the top of the Trace analytics page.
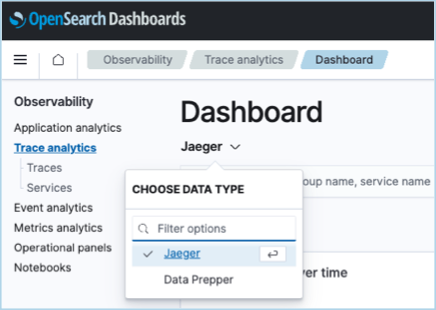
Trace analytics displays data only for the selected time range. The default time range is the last 5 minutes. If no traces appear, generate new data in the sample application or select a longer time range.
Traces
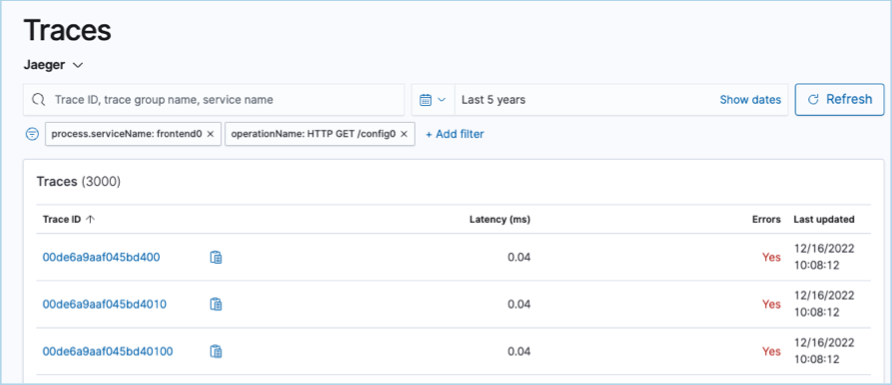
The Traces page lists the traces in the selected time range. For each trace, the list shows the trace ID, latency, whether the trace contains errors, and the time it was last updated.
Error rate
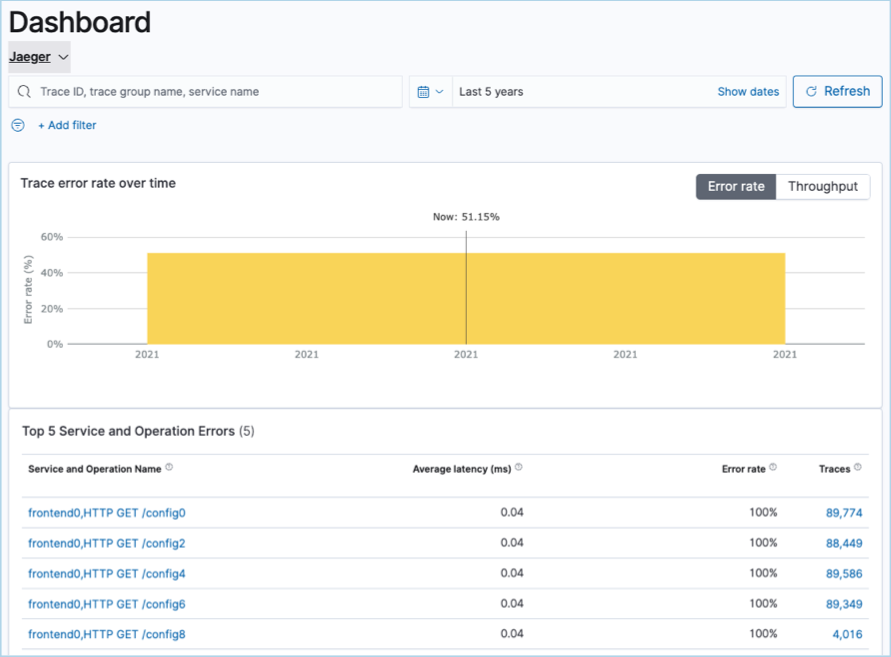
To view error data, expand Service and Operations below the traces list and select Errors. The chart shows the trace error rate over time. The Top 5 Service and Operation Errors table lists the service and operation combinations that have the highest error rates.
Request rate
To view throughput, select Request rate. The chart shows the number of traces over time. The Top 5 Service and Operation Latency table lists the service and operation combinations that have the highest latency.
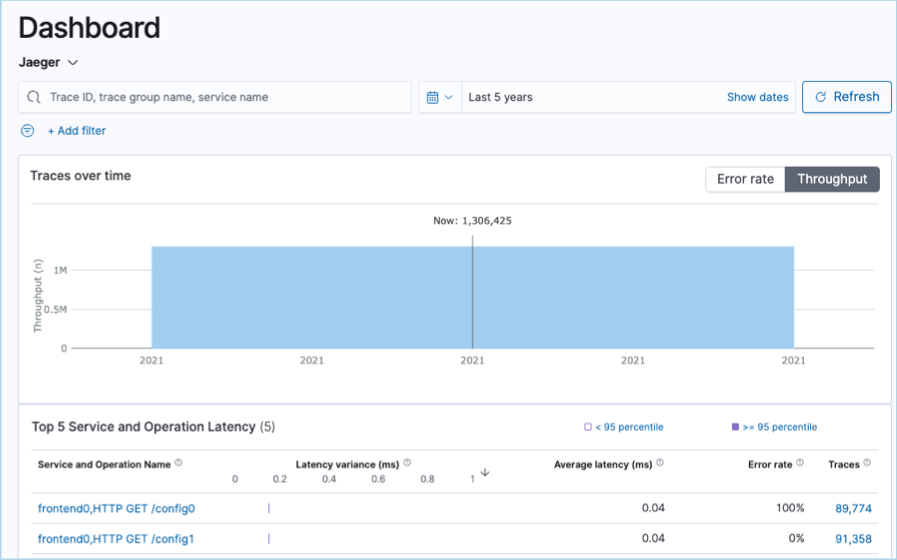
In either table, select a service and operation name to filter the traces list by that service and operation.
Trace details
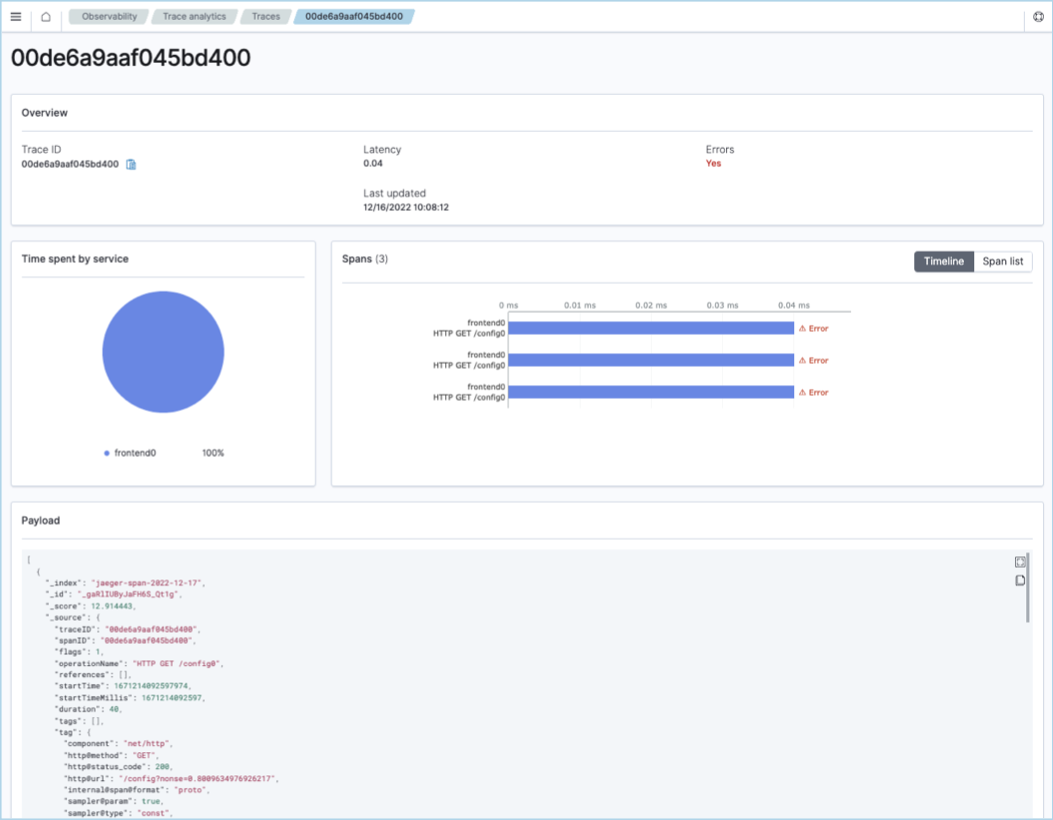
To view the details of a trace, select its trace ID. The trace details page shows the time spent by each service and the spans of the trace as a timeline, a list, or a tree. The Payload section shows the span documents in JSON format.
Services
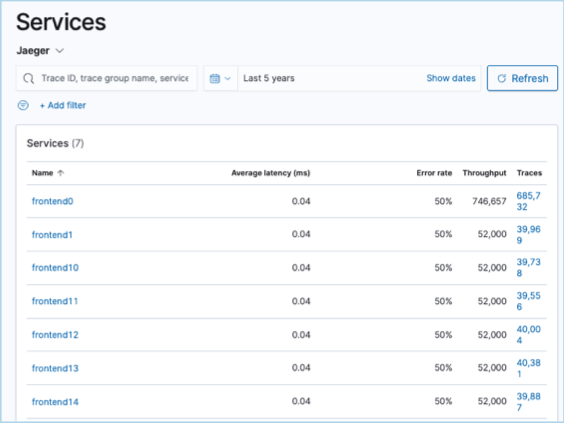
To view the average duration, error rate, request rate, and number of traces for each service, select Services.